MITRE ATT&CK Framework Integration
The MITRE ATT&CK® integration in Trisul Network Analytics enables mapping of network detections to the MITRE ATT&CK framework. This provides structured visibility into observed adversarial techniques, helping analysts correlate alerts with known tactics and techniques.
Overview
Trisul integrates with Suricata-generated alerts and maps them to MITRE ATT&CK techniques. Once configured, detections are visualized in the MITRE ATT&CK Matrix, allowing users to:
- View alerts categorized by ATT&CK techniques
- Identify attack patterns across time ranges
- Drill down into individual alerts
- Access MITRE knowledge base references directly
Prerequisites
Before using the MITRE ATT&CK feature, ensure the following:
1. Switch to NSM Mode
Use the Product Mode Selector to enable NSM (Network Security Monitoring) mode.
2. Install Suricata App
Follow the official setup guide:
https://www.trisul.org/devzone/doku.php/tips:suricata-eve-unixsocket
This enables ingestion of Suricata EVE JSON alerts into Trisul.
Configure MITRE Rules for Suricata
After installing the Suricata app, you must configure the MITRE rules and Suricata settings.
1. Add MITRE Rules File
Copy the provided mitre.rules file to: /var/lib/suricata/rules/
2. Update Suricata Configuration
Replace or update the Suricata configuration file with the provided suricata.yaml at: /etc/suricata/suricata.yaml
This step ensures that Suricata generates alerts enriched with MITRE ATT&CK technique mappings.
Verifying Alert Flow
After completing setup:
- Confirm that Suricata alerts are being received by Trisul
- Ensure alerts are visible in the system before proceeding
- MITRE ATT&CK mapping depends on incoming alert data
If no alerts are present, the matrix will remain empty.
Navigating to MITRE ATT&CK Matrix
👉 Go to MITRE from the main sidebar
👉 Click on MITRE Matrix
This opens the ATT&CK Matrix view within Trisul.
Understanding the MITRE Matrix
The matrix displays techniques organized according to the MITRE ATT&CK framework.
- Each cell represents a Technique ID.
- The number of alerts mapped to that technique is flagged inside the cell.
- Visualization updates based on selected filters.
Time and Alert Filters
You can refine the matrix using:
- Time Frame – Define the duration for analysis
- Max Count – Set the minimum number of alerts to display
Provide the time frame and the number of alerts to be displayed in that time frame and click Search
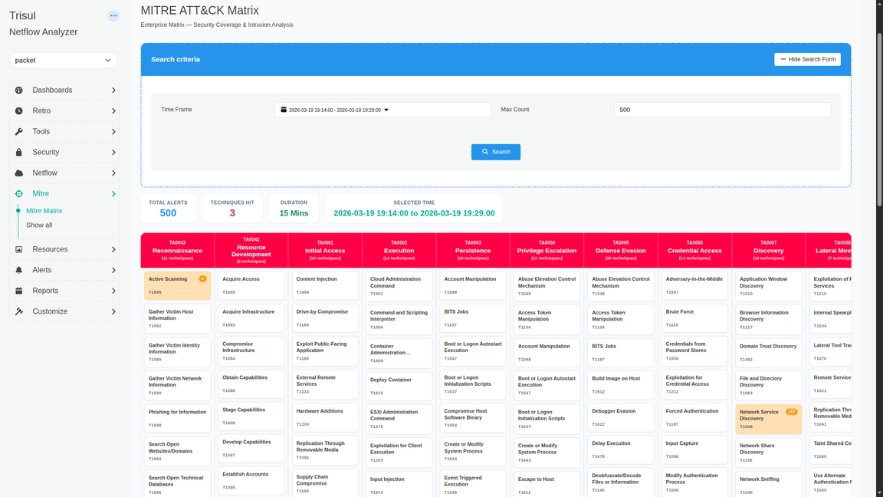
Understanding the MITRE ATT&CK Matrix Parameters
| Parameter | Section | Description | How to Use |
|---|---|---|---|
| Total Alerts | Summary Metrics | Displays the total number of alerts retrieved based on applied filters. | Use this to understand overall alert volume in the selected timeframe. |
| Techniques Hit | Summary Metrics | Indicates the number of unique MITRE techniques triggered. | Helps assess how widespread the activity is across different attack techniques. |
| Duration | Summary Metrics | Shows the time span covered by the selected data. | Useful for understanding alert density and activity frequency. |
| Selected Time | Summary Metrics | Displays the exact time range currently applied. | Confirms the active filter window before analyzing results. |
| Technique Cells (Txxxx) | MITRE Matrix | Each cell represents a MITRE ATT&CK technique and shows the number of alerts mapped to it. | Click on a technique to view all associated alerts and investigate further. |
| Alert Count per Technique | MITRE Matrix | Number displayed within each technique cell indicating alert frequency. | Use this to identify high-activity techniques that may require immediate attention. |
| Technique Drilldown | MITRE Matrix | Opens detailed view of alerts for a selected technique. | Click a technique → view alerts → use Action button to inspect full alert details and MITRE mappings. |
Investigating Alerts
Viewing Alerts by Technique
- Click on any highlighted Technique ID in the matrix
- This opens a detailed view showing all alerts mapped to that technique within the selected time range
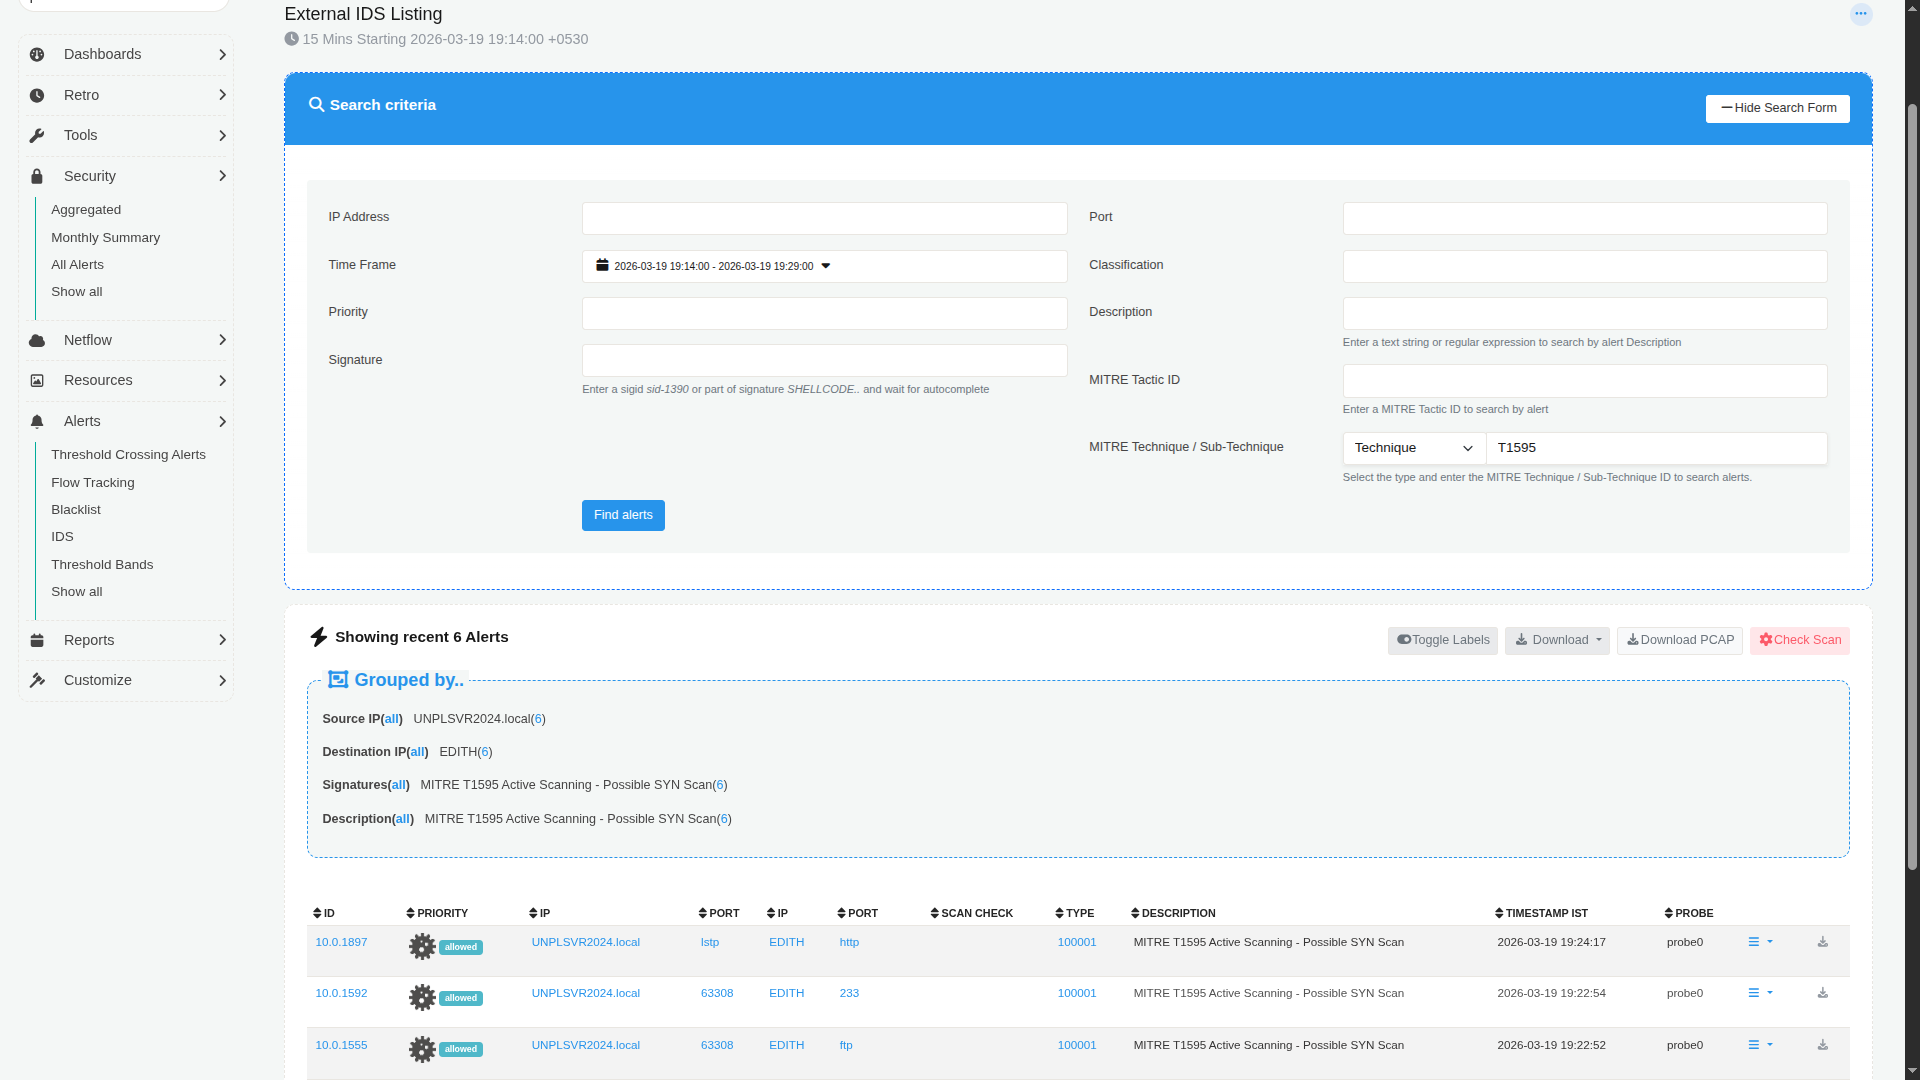
| Parameter | Section | Description | How to Use |
|---|---|---|---|
| Search Criteria | Filter Panel | Allows filtering of alerts using parameters like IP Address, Port, Time Frame, Priority, Classification, Signature, Description, and MITRE IDs. | Use these filters to narrow down alerts for precise investigation. Combine multiple fields to refine results. |
| IP Address | Search Criteria | Filters alerts based on source or destination IP. | Enter a specific IP to isolate activity related to a host. |
| Port | Search Criteria | Filters alerts based on network port. | Useful for identifying service-specific attacks (e.g., HTTP, FTP). |
| Time Frame | Search Criteria | Defines the time range for displayed alerts. | Adjust to focus on a specific incident window. |
| Priority | Search Criteria | Filters alerts based on severity or priority level. | Use to focus on high-priority or critical alerts first. |
| Classification | Search Criteria | Categorizes alerts based on type (e.g., reconnaissance, exploitation). | Helps group alerts by attack nature. |
| Signature | Search Criteria | Filters based on Suricata rule/signature ID or name. | Use known signatures (e.g., sid:1390) to track specific detections. |
| Description | Search Criteria | Text or regex-based filter on alert descriptions. | Useful when searching for keywords like "scan" or "exploit". |
| MITRE Tactic ID | Search Criteria | Filters alerts by MITRE tactic. | Helps isolate alerts under a specific attack phase. |
| MITRE Technique / Sub-technique | Search Criteria | Filters alerts using specific MITRE technique or sub-technique IDs. | Enter IDs (e.g., T1595) to focus on a particular behavior. |
| Find Alerts | Action Button | Executes the search based on selected filters. | Click to refresh the alert list after applying filters. |
| Grouped By | Alert Summary | Displays alerts grouped by Source IP, Destination IP, Signature, and Description. | Use this to quickly identify patterns or repeated behaviors. |
| Alert Table | Results Table | Lists individual alerts with detailed fields such as ID, Priority, IPs, Ports, Type, Description, Timestamp, and Probe. | Scan rows for anomalies and click into specific alerts for deeper inspection. |
| Priority Indicator | Alert Table | Visual label indicating alert severity (e.g., allowed, high priority). | Helps quickly identify critical alerts. |
| Scan Check | Alert Table | Indicates scan-related detection or classification. | Useful for identifying reconnaissance activities. |
| Timestamp | Alert Table | Shows when the alert was triggered. | Correlate events across time for incident analysis. |
| Probe | Alert Table | Identifies the sensor or probe that generated the alert. | Useful in multi-probe deployments. |
| Download / PCAP / Actions | Controls | Options to download alert data or packet captures. | Use for offline analysis or sharing with other teams. |
Alert Details
Each alert entry provides:
- Technique ID
- Sub-technique ID
- Tactic ID
Use the Action button to view detailed alert information.
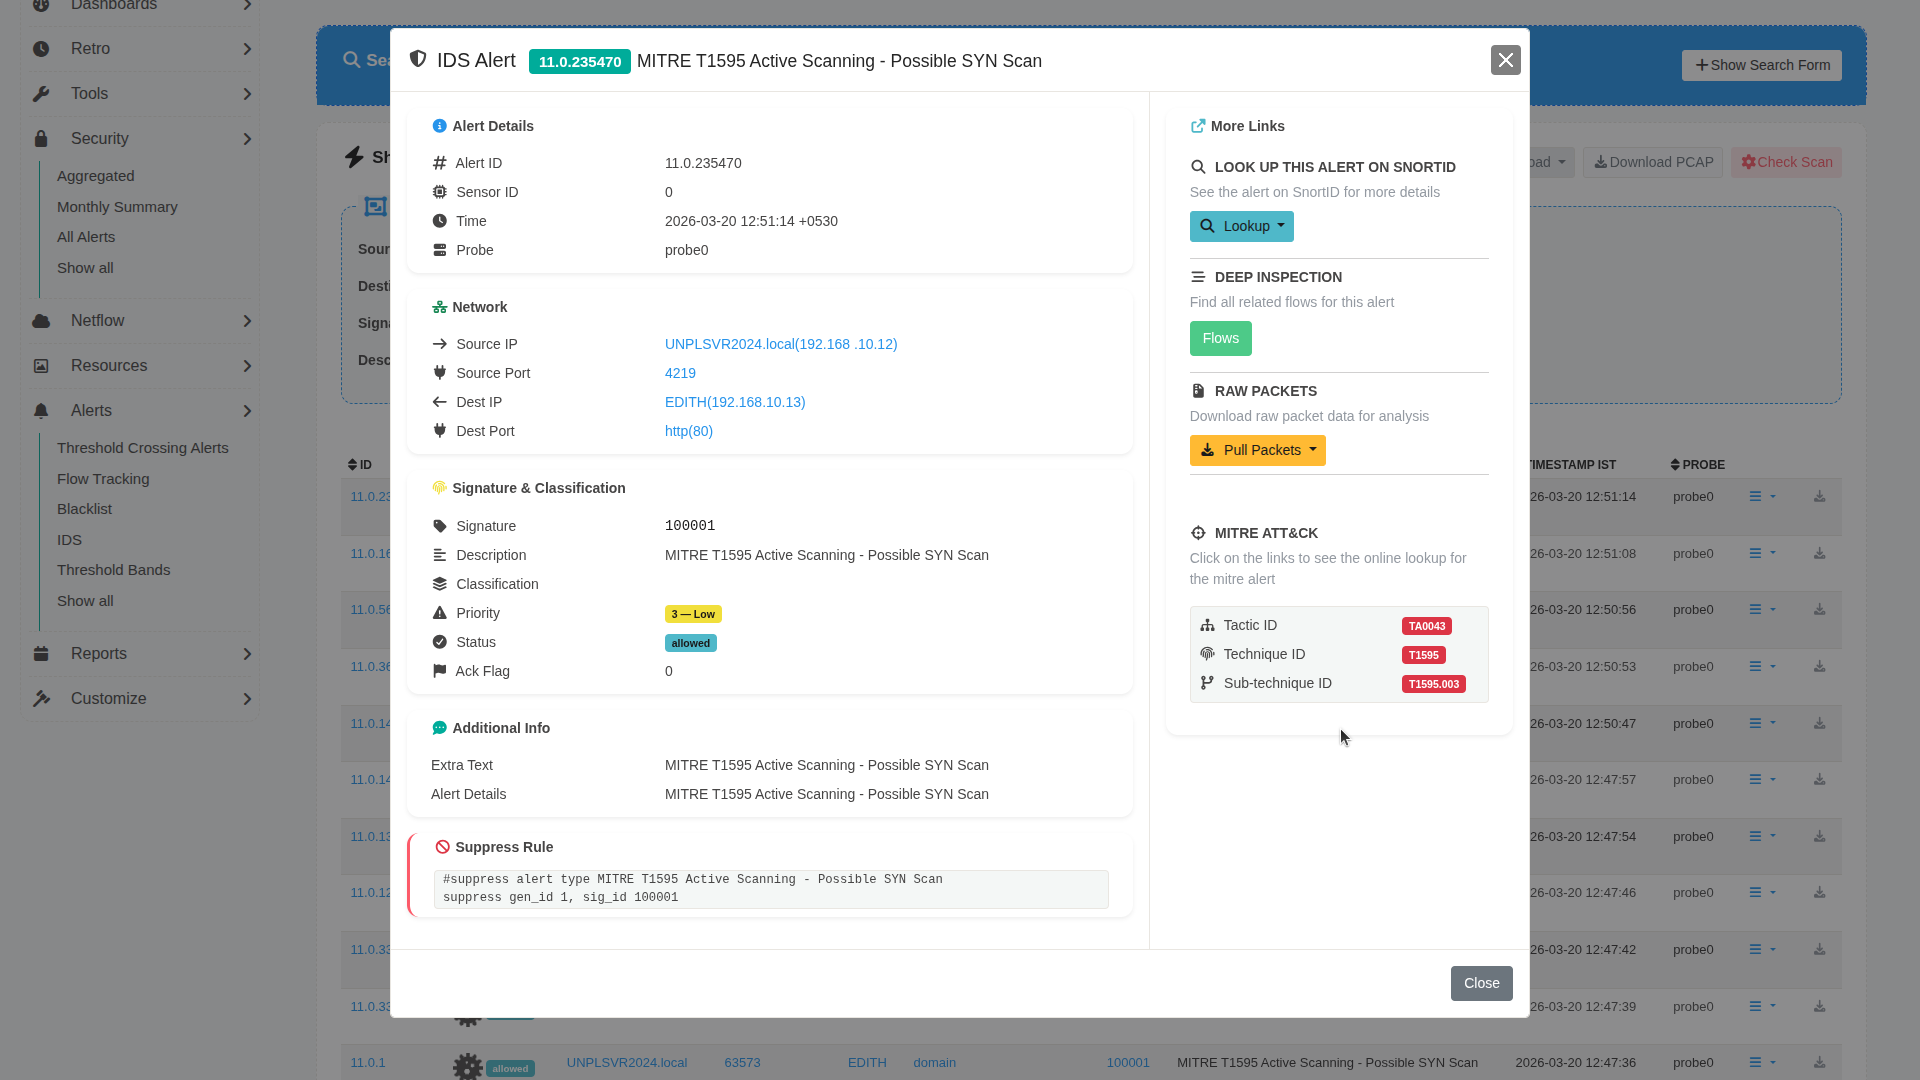
| Parameter | Section | Description | How to Use |
|---|---|---|---|
| Alert ID | Alert Details | Unique identifier for the alert. | Use this ID to track, reference, or correlate the alert across systems. |
| Sensor ID | Alert Details | Identifier of the sensor generating the alert. | Useful in multi-sensor environments to trace alert origin. |
| Time | Alert Details | Timestamp when the alert was generated. | Helps correlate with other network events. |
| Probe | Alert Details | Indicates the probe or monitoring instance. | Useful for identifying where the alert was captured. |
| Source IP | Network | Originating IP address of the activity. | Identify the potential attacker or source system. |
| Source Port | Network | Port used by the source. | Helps determine the type of communication initiated. |
| Destination IP | Network | Target IP address. | Identify the affected system. |
| Destination Port | Network | Target service port (e.g., HTTP 80). | Helps understand the targeted service. |
| Signature | Signature & Classification | ID of the detection rule (e.g., Suricata SID). | Use to identify the rule that triggered the alert. |
| Description | Signature & Classification | Human-readable description of the alert. | Quickly understand the nature of the activity. |
| Classification | Signature & Classification | Category of the alert (e.g., scanning, exploitation). | Helps group alerts by attack type. |
| Priority | Signature & Classification | Severity level of the alert. | Focus on higher priority alerts first. |
| Status | Signature & Classification | Indicates if the alert was allowed or blocked. | Helps assess whether action was taken. |
| Ack Flag | Signature & Classification | Indicates if the alert has been acknowledged. | Use for tracking investigation progress. |
| Extra Text | Additional Info | Additional contextual information. | Provides extended insight into the alert. |
| MITRE Mapping | MITRE ATT&CK | Displays associated Tactic ID, Technique ID, and Sub-technique ID. | Click on IDs to view details in the MITRE ATT&CK knowledge base. |
| Snort/External Lookup | More Links | Option to look up the alert externally (e.g., Snort ID). | Use for additional threat intelligence. |
| Flows | Deep Inspection | Shows related network flows. | Investigate traffic patterns related to the alert. |
| Pull Packets | Raw Packets | Downloads packet-level data (PCAP). | Use for deep packet inspection and forensic analysis. |
| Suppress Rule | Suppression | Provides rule syntax to suppress similar alerts. | Use to reduce noise from known or benign alerts. |
Accessing MITRE Knowledge Base
From the alert details view:
- Click on:
- Technique ID
- Sub-technique ID
- Tactic ID
These links redirect to the official MITRE ATT&CK knowledge base for deeper context.
Summary
Once configured, the MITRE ATT&CK integration provides:
- Structured mapping of detections to ATT&CK techniques
- Visual representation via the ATT&CK matrix
- Drill-down analysis of alerts
- Direct linkage to MITRE knowledge base