Investigate Threshold Crossing Alerts
All modes. Step 5 (packet analysis) needs packet capture.
Investigation Overview
Sudden increases in bandwidth utilisation, connection rates, flow counts, or other network metrics are often the earliest indicators that something within the network has changed. These changes may be caused by legitimate operational activities such as backups, software deployments, or increased business demand, but they can also indicate application issues, misconfigurations, resource exhaustion, or emerging security events.
A threshold crossing investigation begins with a triggered alert and progressively determines why the alert occurred, how significant it was, which monitored entity generated it, whether the observed behaviour was expected, what operational impact it had, and whether additional investigation is required.
Using Trisul, this entire workflow can be completed from the triggered alert without switching between multiple monitoring tools.
When to Use This Investigation
Use this investigation when you need to:
- Investigate an alert indicating excessive bandwidth utilisation.
- Determine why a monitored metric exceeded its configured threshold.
- Identify the hosts, interfaces, applications, or other monitored entities responsible for the threshold crossing.
- Determine whether the observed behaviour represents expected operational activity.
- Prioritise operational response before users are affected.
Investigation Objectives
By completing this investigation, you should be able to:
- Determine which metric exceeded its threshold.
- Understand the severity of the threshold crossing.
- Identify the monitored entity responsible for the threshold crossing.
- Determine whether the observed behaviour is expected.
- Assess the operational impact.
- Determine whether additional investigation or corrective action is required.
Investigation Workflow
Step 1: Review the Threshold Crossing Alert
Every threshold investigation begins by understanding exactly what triggered the alert. Before investigating hosts, interfaces, or applications, establish which metric exceeded its configured threshold, when the event occurred, and which monitored object generated the alert.
Open Threshold Crossing Alerts and select the triggered alert.
This investigation needs at least one configured TCA. See Create a new TCA.
Use the alert details to answer questions such as:
- Which metric exceeded its configured threshold?
- Which interface, host, application, or monitored object generated the alert?
- When did the threshold crossing occur?
- Is the alert still active or has the metric already returned to normal?
Evidence to Collect
- Metric that triggered the alert.
- Affected monitored object.
- Configured threshold value.
- Observed value.
- Time the threshold crossing occurred.
Next Step
Once the alert has been understood, determine how significant the threshold crossing was before investigating the behaviour responsible for generating it.
Step 2: Measure the Magnitude of the Threshold Crossing
Knowing that a threshold has been crossed is only part of the investigation. The next objective is determining how far the observed metric exceeded its configured threshold and whether it represents a brief operational spike or sustained abnormal behaviour.
Review the historical trend for the affected metric.
Use the historical data to answer questions such as:
- How much did the observed value exceed the configured threshold?
- Was the increase gradual or sudden?
- How long did the threshold remain exceeded?
- Has similar behaviour occurred previously?
Evidence to Collect
- Peak observed value.
- Duration of the threshold crossing.
- Historical trend.
- Frequency of similar events.
- Whether the metric returned to normal.
Next Step
Once the significance of the threshold crossing has been established, identify the monitored entity responsible for generating the observed behaviour.
Step 3: Investigate the Observed Activity
Continue the investigation in Explore Flows using the monitored entity and time period identified by the threshold alert. Investigate the communication activity responsible for the threshold crossing without assuming the cause in advance.
This step helps answer questions such as:
- Which network entities contributed to the threshold crossing?
- Which communication patterns generated the observed activity?
- Which conversations accounted for the increase?
- Which observations require deeper investigation?
- Which entities appear responsible for the alert?
Evidence to Collect
- Network entities contributing to the threshold crossing.
- Significant communication patterns.
- High-volume conversations.
- Network objects requiring further investigation.
- Initial evidence explaining the alert.
Continue the Investigation
Once the contributing entities have been identified, analyse the applications responsible for the observed activity.
Step 4: Analyze Application Activity
Remain within Explore Flows and review the Top Applications for the investigation period.
Application visibility helps determine whether the threshold crossing was caused by expected operational activity, scheduled maintenance, backups, software deployments, increased business demand, or unexpected application behaviour.
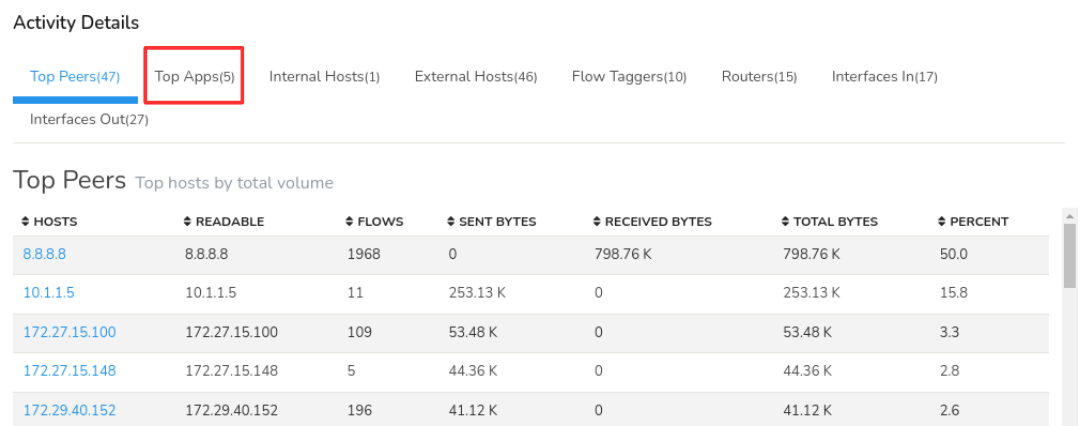
Figure: Top Applications
This step helps answer questions such as:
- Which applications generated the activity responsible for the threshold crossing?
- Did application behaviour change during the alert?
- Were the observed applications expected?
- Do the applications explain why the threshold was exceeded?
- Are unexpected services or protocols present?
Evidence to Collect
- Applications contributing to the threshold crossing.
- Significant application activity.
- Expected operational traffic.
- Unexpected applications or protocols.
- Applications requiring further investigation.
Continue the Investigation
After identifying the applications involved, review the aggregate traffic profile to validate the investigation findings.
Optional Validation: Review Aggregate Traffic
Most threshold investigations can be completed using Explore Flows. Where additional validation is required, Aggregate Flows provides a summarized view of the investigated traffic.
Rather than introducing new evidence, Aggregate Flows groups the flow records by dimensions such as IP address, interface, application, port, router, and other network attributes. This helps confirm whether the threshold crossing is concentrated within a particular network entity or distributed across multiple contributors.
This step helps answer questions such as:
- Do the aggregate statistics support the investigation findings?
- Which network entities dominate the observed traffic?
- Is the threshold crossing concentrated within specific hosts, interfaces, or applications?
- Does the aggregate traffic profile explain why the threshold was exceeded?
Evidence to Collect
- Aggregate traffic distribution.
- Dominant network entities.
- Traffic concentrations.
- Aggregate evidence supporting the investigation.
Continue the Investigation
If packet capture is available, continue with Packet Analysis to validate the observed network behaviour.
Step 5: Validate with Packet Analysis
Where packet capture is available, continue directly from Explore Flows by downloading the PCAP for the selected flow records.
Packet-level analysis helps validate the conclusions drawn from the flow investigation and provides protocol-level evidence explaining the behaviour responsible for the threshold crossing.
This step helps answer questions such as:
- Does packet-level analysis support the investigation findings?
- Are protocol anomalies visible?
- Does the packet data explain the threshold crossing?
- Is additional evidence required before completing the investigation?
Evidence to Collect
- Packet-level evidence supporting the investigation.
- Protocol anomalies.
- Communication failures or retransmissions.
- Evidence validating the threshold crossing.
Continue the Investigation
Once the network activity has been validated, determine whether the threshold crossing had any measurable operational impact.
Step 6: Assess the Operational Impact
After understanding the network activity responsible for the threshold crossing, determine whether it had any measurable impact on network operations or business services.
Some threshold crossings represent normal operational events, while others indicate degraded performance, congestion, resource exhaustion, security concerns, or emerging capacity limitations.
This step helps answer questions such as:
- Did users experience degraded performance?
- Were business applications affected?
- Was interface congestion observed?
- Did latency or packet loss increase?
- Did services recover after the threshold crossing ended?
Evidence to Collect
- Performance degradation.
- Service interruptions.
- User-reported issues.
- Resource utilisation.
- Operational impact of the threshold crossing.
Continue the Investigation
Once the operational impact has been assessed, determine whether the investigation has fully explained the alert or whether additional investigation is required.
Step 7: Determine the Appropriate Follow-up Investigation
Review the investigation findings as a whole to determine whether the threshold crossing has been fully explained or whether additional investigation is required.
The objective of this step is to decide whether operational action, further investigation, or long-term corrective measures are necessary.
This step helps answer questions such as:
- Can the threshold crossing be fully explained?
- Was the observed behaviour expected?
- Does the configured threshold require adjustment?
- Is operational intervention required?
- Should capacity planning be considered?
- Which specialised investigation should continue the analysis?
- Does the behaviour require escalation to a security investigation?
Evidence to Collect
- Confirmed cause of the threshold crossing.
- Responsible network entities.
- Evidence supporting the investigation findings.
- Operational impact assessment.
- Recommended follow-up investigation.
- Capacity planning or escalation recommendations.
Summarize the Investigation with Trisul AI
By this stage, the investigation should have established why the threshold crossing occurred and collected the evidence required to explain the alert.
Open Trisul AI and review the investigation findings.
Use Trisul AI to generate a concise summary of the investigation, highlight the key observations, and assist with documenting the findings for operational review, incident reporting, or future reference.
Investigation Completion
This investigation can generally be considered complete when:
- The triggered alert has been fully understood.
- The severity of the threshold crossing has been established.
- The monitored entity responsible for the threshold crossing has been identified.
- The observed behaviour has been determined to be expected or unexpected.
- The operational impact has been assessed.
- The appropriate follow-up investigation or operational action has been identified.
Best Practices
- Treat threshold alerts as the beginning of an investigation rather than the conclusion.
- Investigate sustained threshold crossings before isolated spikes.
- Determine whether observed behaviour is expected before escalating the investigation.
- Correlate threshold crossings with the monitored entities responsible for generating them.
- Review configured thresholds periodically as network behaviour evolves.
- Use recurring threshold crossings to identify long-term capacity trends.
- Continue with specialised investigations when deeper analysis of a host, interface, application, or other monitored entity is required.
Related Investigations
- Investigate High Traffic on a Network Interface – Continue investigating if the threshold crossing is isolated to a specific interface.
- Investigate the Network Activity of an IP Address – Continue investigating if the threshold crossing is tied to a specific host.
- Investigate Historical Network Activity – Determine whether similar threshold crossings have occurred in the past.
- Correlate Network Activity Across Multiple Dimensions – Analyse the alert alongside application, interface, or site dimensions if a single-entity view doesn't fully explain it.