Probe Health
This menu is nothing but a Probe Health Monitor. It shows the reachability, current traffic, and latency of Trisul Probes in this particulat context.
👉 Go to Context: Default → Admin Tasks → Probe Health
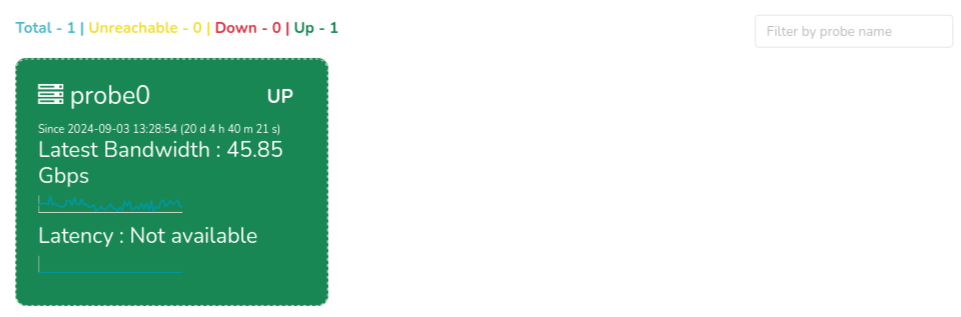
Figure: Probe Health
-
On the header section you can see the count for Total No.of Probes, No.of Unreachable Probes, No.of Probes Up/Down. The color of the probe represents the state, say,
Green: The probe is UP and running
Yellow: The probe is UNREACHABLE
Red: The probe is DOWN -
Also you can see the Latest Bandwidth in Gbps for each probe, The time since the probe is up/down state and its latency if any. Hover over the sparkline to view the tooltip of data displaying bandwidth at different points of time.
-
You can also search for a particular probe by entering the probe name on the filter bar "Filter by probe name" on the upper right hand side to display only the desired probe health data.