Trisul Data Flow
This page provides a high-level summary of how network data flows through Trisul, from the point it enters the platform to the point where it becomes available for monitoring and analysis.
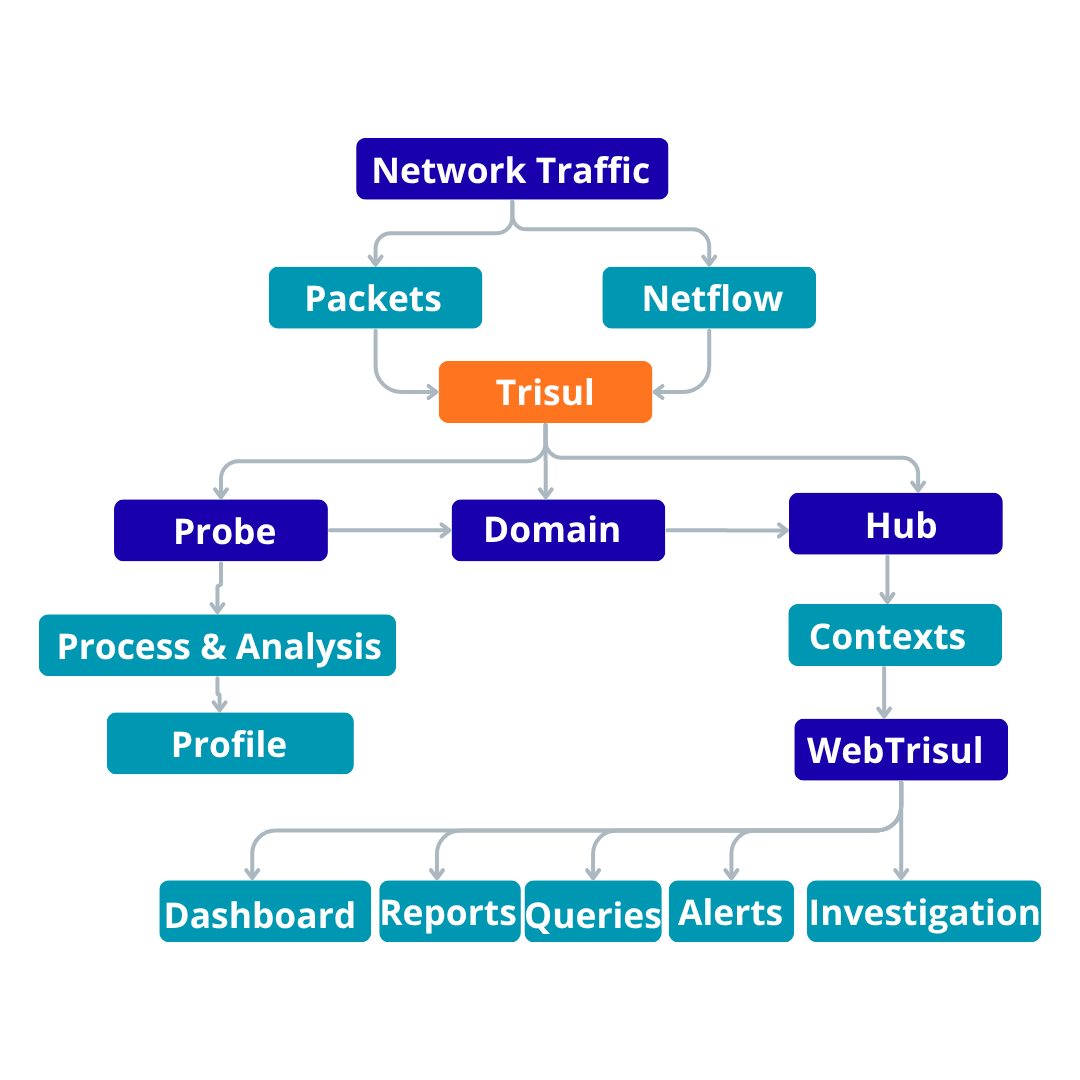
Figure: Data Flow
The sections below explain the different input modes and the main stages involved in processing and storing the data.
What Happens to the Data
-
The network traffic is received in the form of packets and netflow in the probe. Once the input reaches the Probe, Trisul performs streaming analytics on the incoming data.
-
The Probe processes and analyses the metadata and sends it to the Hub.
-
The Domain is the trusted group of Probes and Hubs that can communicate securely. The Probe and the Hub exchange data inside the Domain.
-
The Hub stores the data per Context. A Context is an isolated instance (tenant) with its own database.
-
The stored data is then available through WebTrisul, where users can view and analyze it through dashboards, reports, queries, alerts, and investigation tools.
In both input processing modes, the data follows the same overall path:
Network Input → Probe → Domain → Context → Hub → WebTrisul
The difference is in the type of network input received by the Probe:
Input Processing Modes
Trisul supports two input processing modes based on how network data enters the platform:
- Flow-Based Mode - Trisul receives flow records such as NetFlow, IPFIX, or sFlow from network devices and processes those records for analysis.
- Packet Capture Mode - Trisul receives and analyzes network packets directly from the network.
Processing Mode therefore describes how network data enters Trisul and how the Probe processes that input.
Processing Mode is different from Product Mode, which describes how Trisul is intended to be used for certain use cases. See Product Modes.