View Dashboard
Trisul IPDR Dashboard provides a visual representation of network activity data, providing real-time insights and analytics on internet usage patterns. It's a centralized platform that displays key metrics statistics and the output for submitted queries for IPDR logs.
To view IPDR Dashboard,
👉 Login as User name: dotuser and password.
Once logged in and the Trisul IPDR Query form is submitted, You can view the Trisul IPDR Dashboard and Menu.
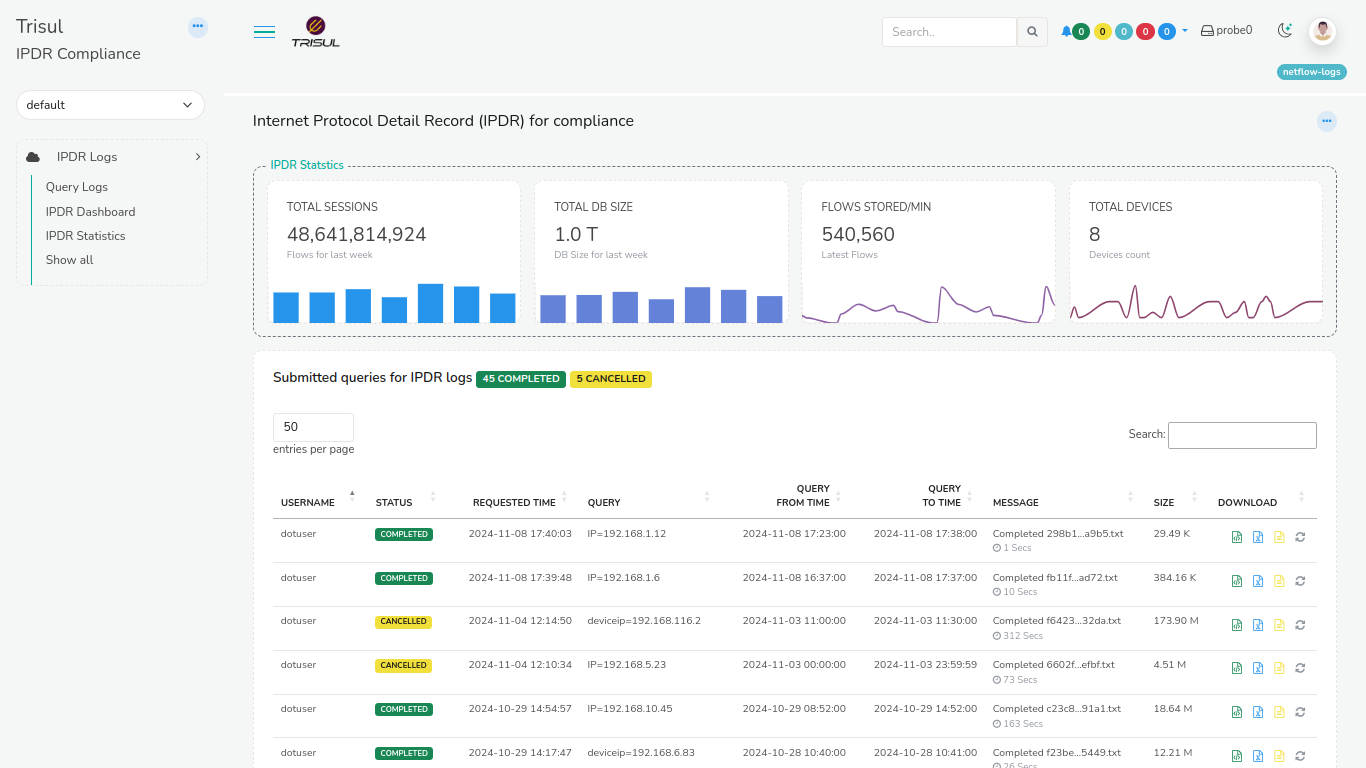
This is the example of the logged in screen that you will be taken to.
IPDR Menu
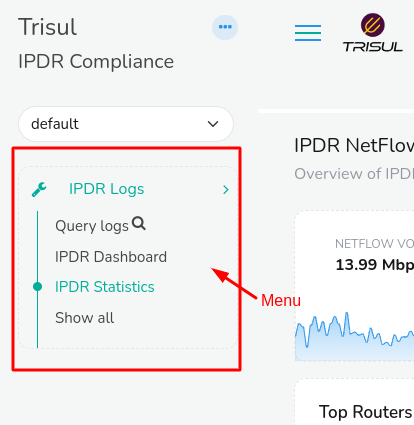
On the Left side of the screen you can find the IPDR menu where you can navigate to:
-
IPDR Dashboard
-
Show all. Click on Show all to view all other tools and dashboards for analysis.
IPDR Dashboard
IPDR dashboard consists of overview of modules that displays IPDR statistics and the record details of submitted queries for IPDR logs that are explained below. This is an example of Trisul IPDR dashboard.
Dashboard Components
Trisul IPDR Dashboard consists of two components
-
IPDR Statistics
-
Submitted queries for IPDR logs
IPDR Statistics
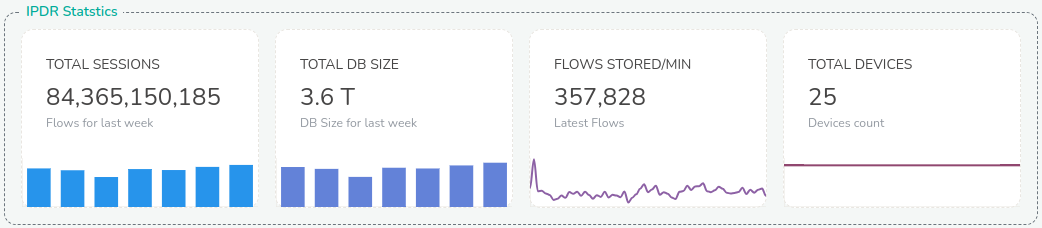
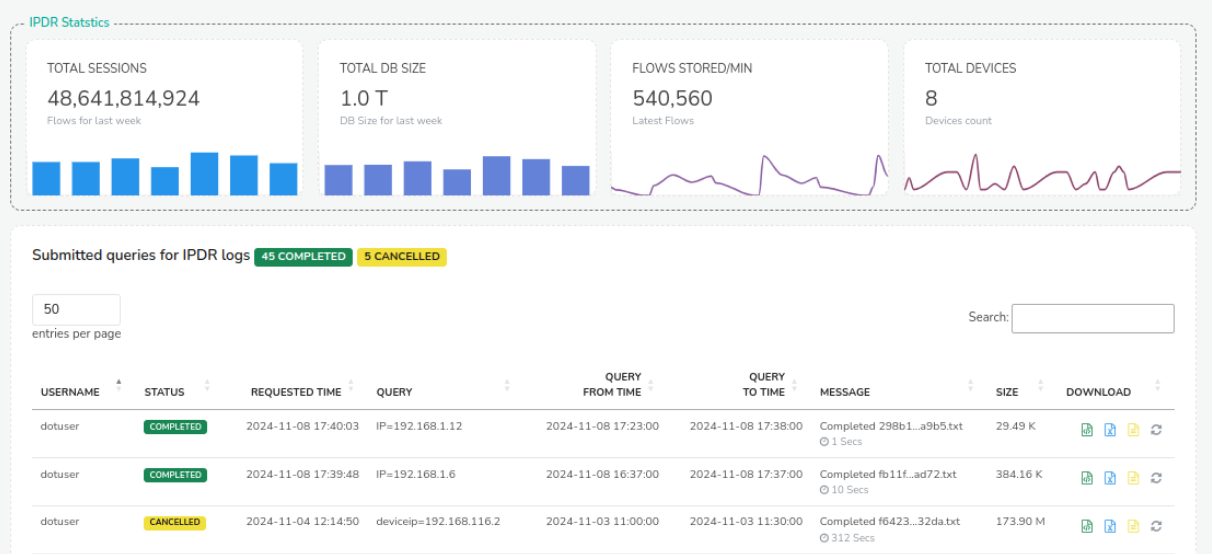
IPDR Statistics consists of modules that provide real-time and historical insights into network activity, including:
Total Sessions
This module displays the total number of flows captured by trisul for the last week. The bar chart in this module consists of seven bars each representing flows stored per day for 7 days.
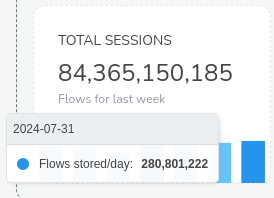
You can hover over the chart to view the statistics data of flows stored per day for the last seven days.
Total DB Size
This module shows you the total Database size for the last seven days. Similar to total sessions module, in this each bar in the bar chart displays the disk usage per day for the last seven days by default.
Flows Stored Per Minute
In this module you can see the total number of flows (network connections) stored per minute by Trisul. The Sparkline in this module are real-time flows stored per minute for the last one hour.
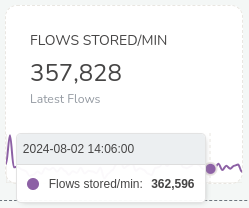
You can hover over on the sparkline to view the value of flows stored per minute at any point of time for the past one hour.
Total Devices
This module gives you the total number of unique devices (IP addresses) detected by Trisul since the last one hour. The sparkline in this module represents the number of devices for the past one hour. You can hover over the sparkline to view the real-time total count of devices at any point of time for the past one hour.
Submitted Queries for IPDR Logs
In this module you can see the result for custom queries for IPDR logs submitted by the user. Trisul captures the specific IPDR data based on user defined criteria. The parameters of the logs are exactly as per the regulatory requirements and sufficient for audit/compliance.
This is a sample of Trisul IPDR log.
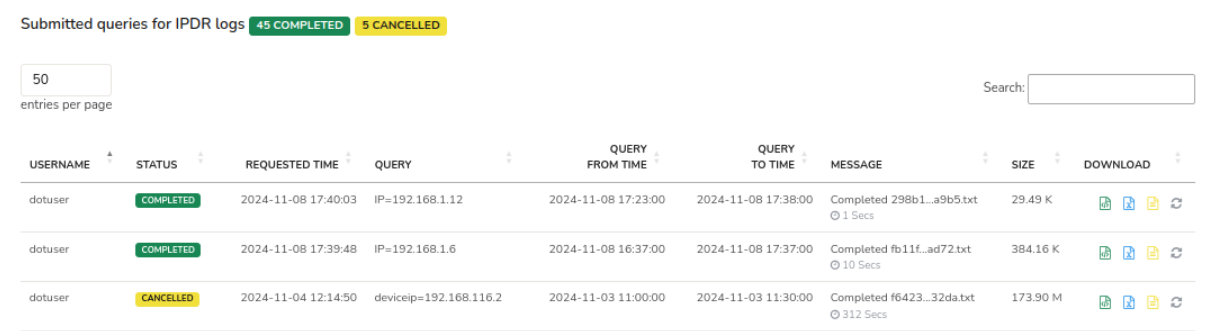
Let us explore the components of the IPDR log module in the following.
The header of the module contains the total number of status of queries Started/Completed/Cancelled by the user.
User Name: This is the name of the user who initiated the query.
Status: This is the status of the query being processed. When a new query has been requested it will show as NEW. When the query has started processing it will show as STARTED. When the query has processed it will show as COMPLETED. And when the query has been cancelled before completion it will show as CANCELLED.
Requested Time: This is the time that the user has submitted the query using the IPDR query form.
Query: The specific IP address provided by the user in the IPDR query form.
Query From Time: The IPDR data requested from this specific time by the user.
Query To Time: The IPDR data requested until this specific time by the user.
Message: This is the hash of the report file being generated for the particular query.
Size: This is the file size of the generated report for the query.
Download: You can download the report in .txt, excel, or in CSV formats.
Once you have the query processing completed on the dashboard which will typically take less than 10 seconds. You can click the download button of the desirable format and the report will be downloaded!
Cancellation
The user can cancel long running tasks by clicking the Cancel button against the query that has just started processing. The results that have been retrieved up until that point is immediately made available for download and/or FTP.