ISP Analytics Dashboard
Several ISPs have deployed Trisul in their networks to gain deep insights into their peering and routing efficiencies. In addition to the normal metrics, device, and interface level drilldowns made available in Trisul Netflow Analytics , the Trisul ISP configuration adds the following.
- Peering Analytics
- Prefixes IPv4 and IPv6
- AS analytics
- Mapping ASN, Prefixes, Geo location to gateway routers and interfaces
- Private Peering analytics with content providers
- Route analytics
- Custom metering of downstream customers usage patterns
Trisul provides a global level dashboard for ISP Analytics that includes several menus with various functionalities.
To install the ISP dashboard apps, Refer ISP Analytics Dashboard
ISP Overview
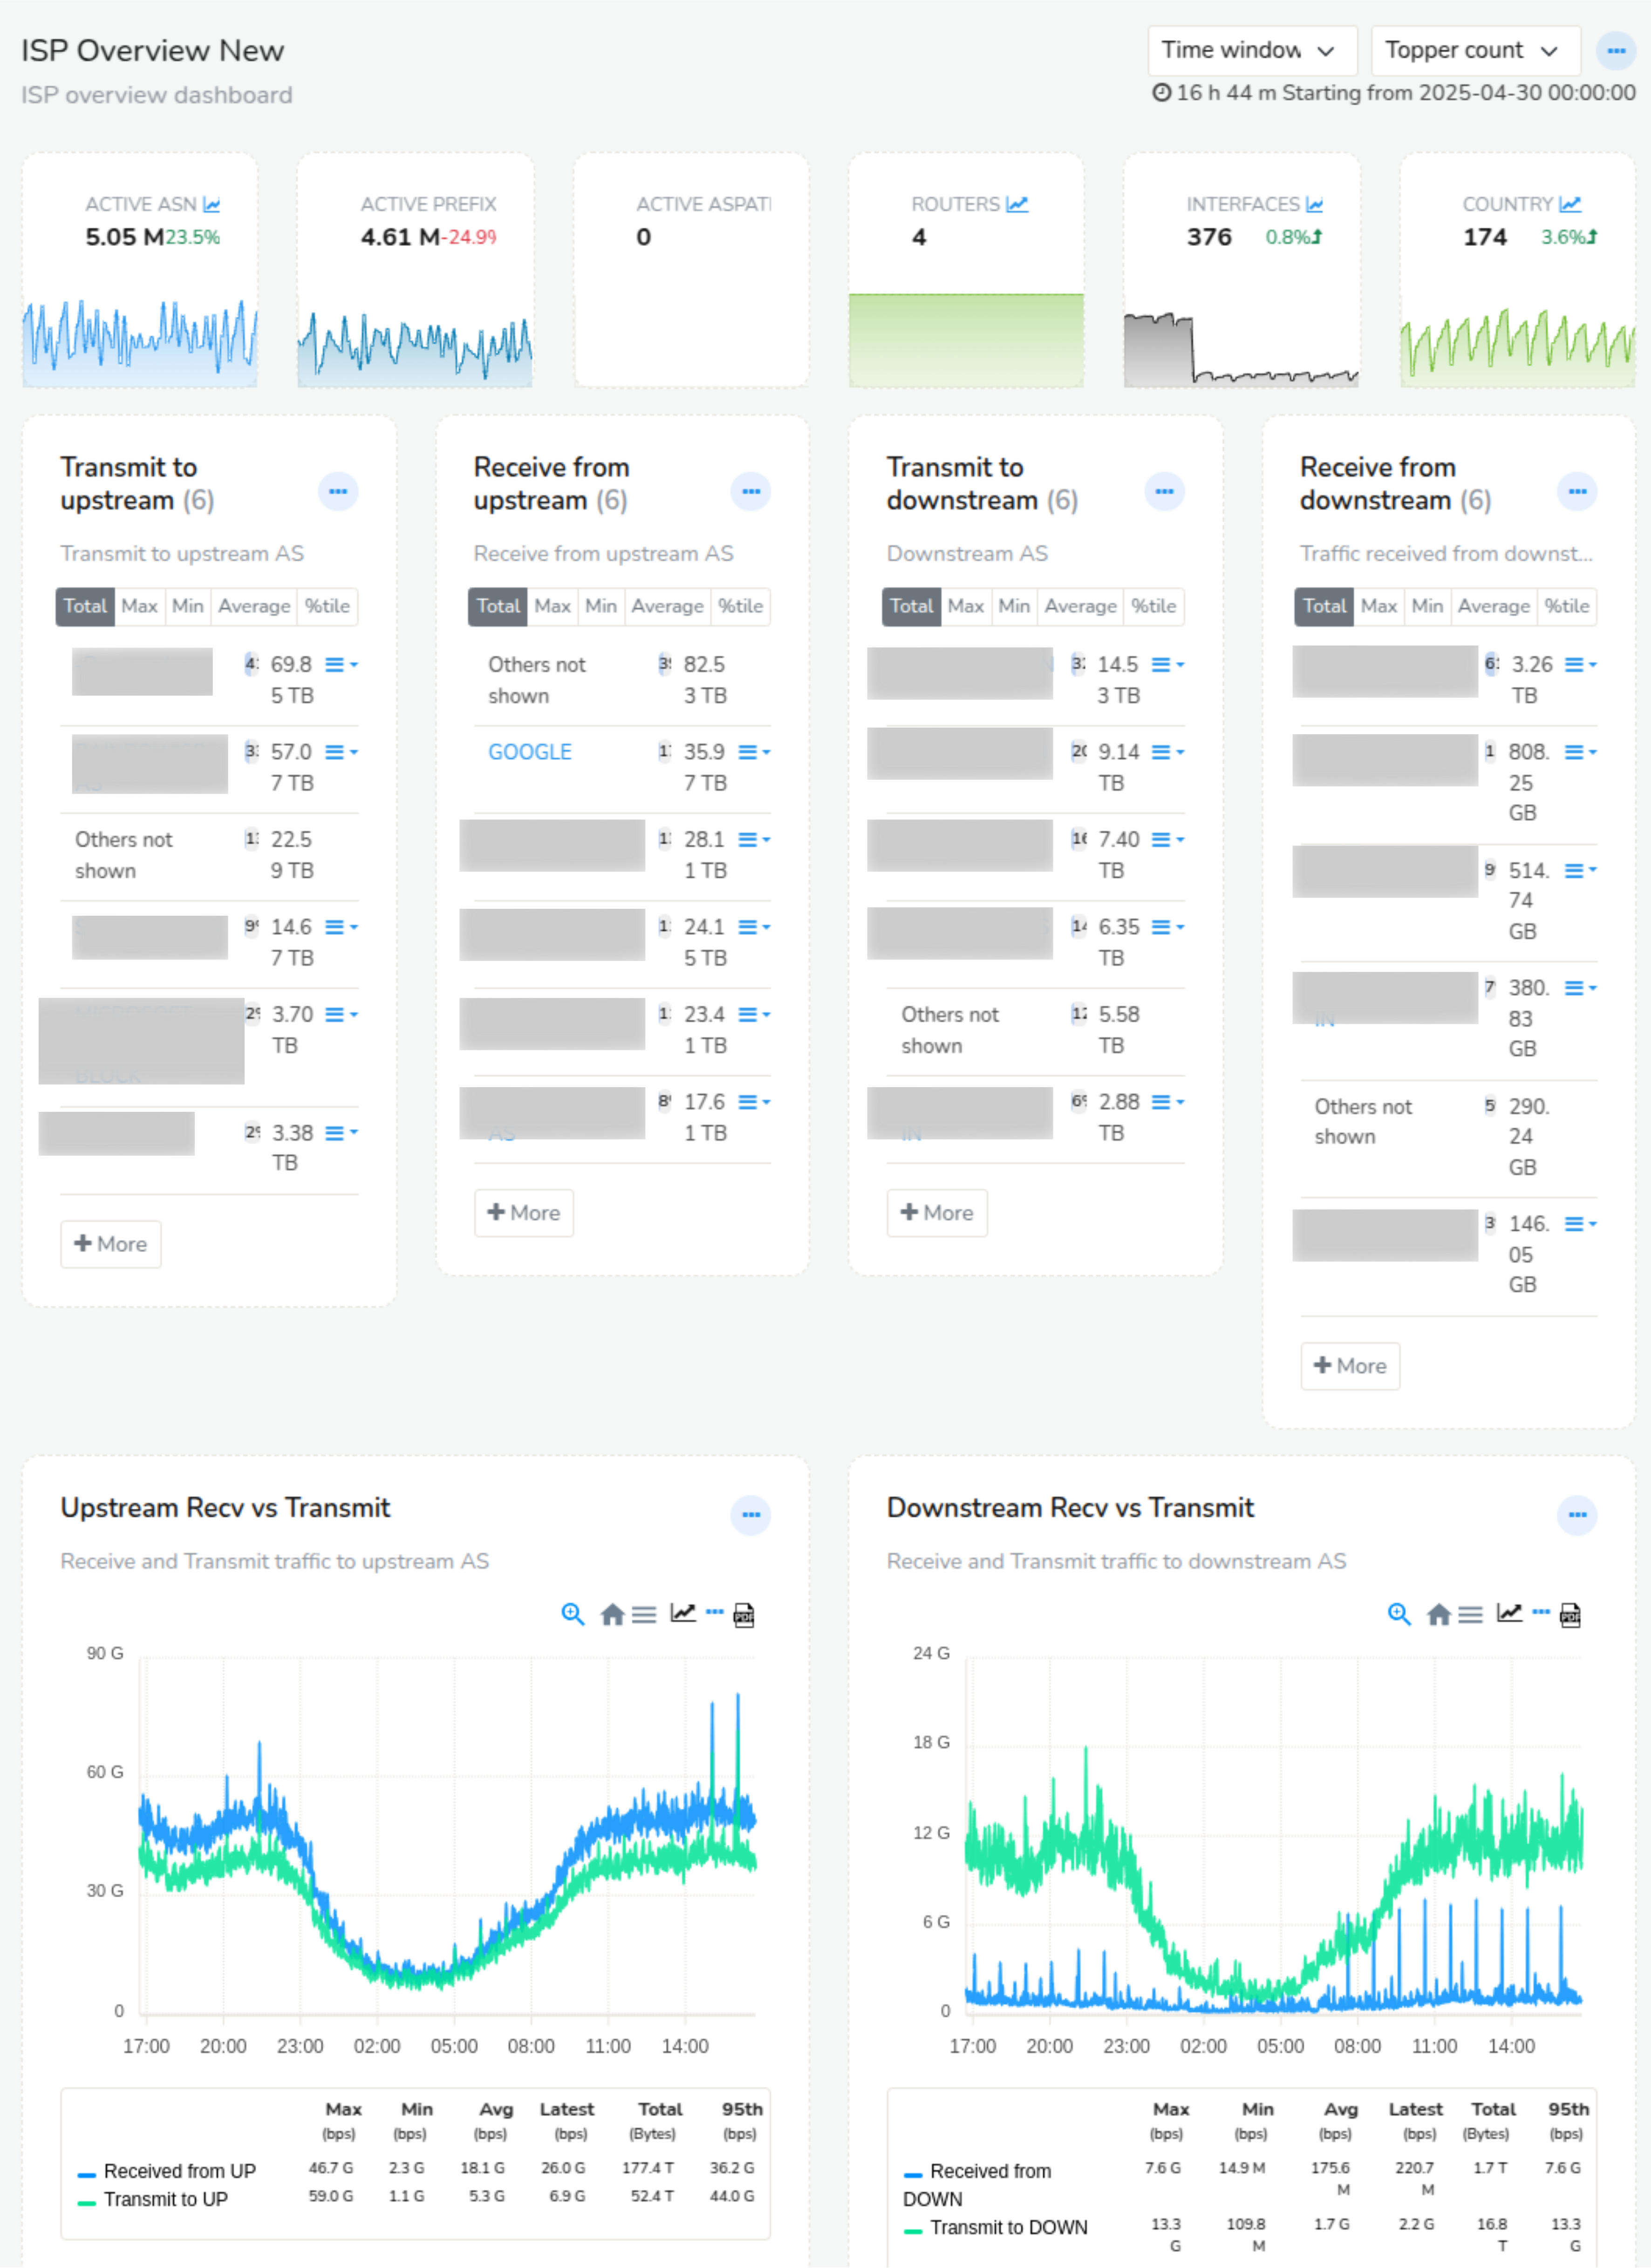
ISP Overview is a top level dashboard in Trisul ISP Analytics. It provides a overall stats about the Active AS, prefixes, paths, total routers, interfaces and countries.
Also it provides statistical information on the total volume of Upload and Download of AS Traffic in bytes.
To access, Login as user & Select Dashboard → Show All → Enter ‘ISP Overview’ in Filter
ISP Overview
Peering Analytics
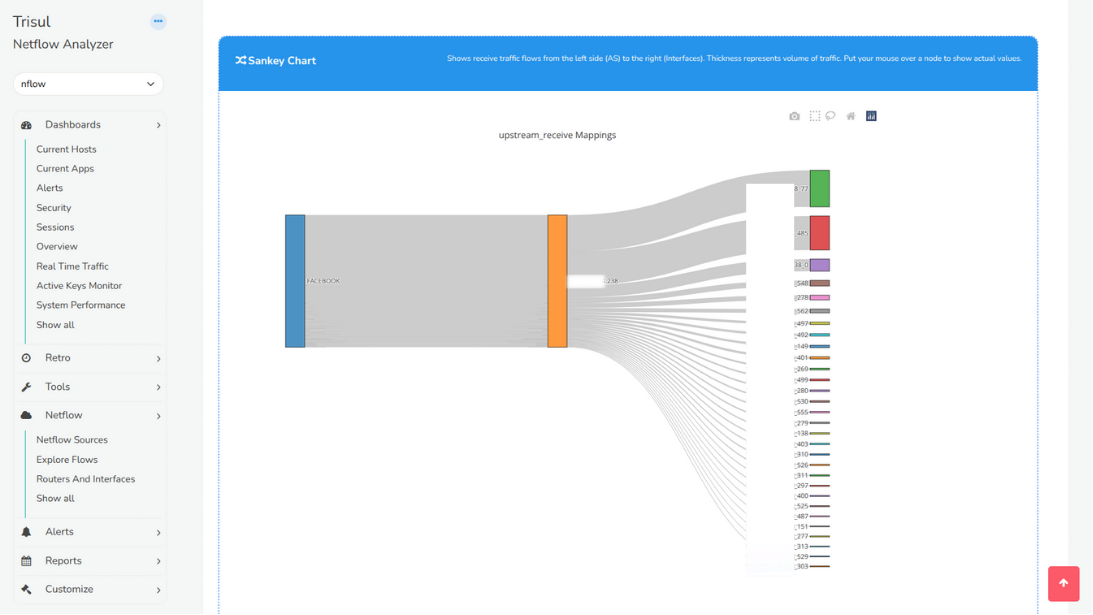
Peering analytics provides ASN Traffic mapping for routers and interfaces. ISP Peering analytics shows detailed information about the Top Upload and Download AS peers for respective Router and Interface. The traffic flows are further split by upstream vs downstream.
With the help of this Dashboard, You can view ASN Mappings for Routers and Interfaces. The default shows the Flow-ASN which represents the actual routing table. Traffic charts provide history of Peer AS x Interface from Upstream/Downstream
Received from upstream: How much data is received by the interface
(IN) from these upstream AS
Transmit to upstream: Data transfer to upstream AS
Receive from downstream: Received from downstream AS
Transmit to downstream: Data transfer to downstream AS
Typically, the Receive from Upstream and Transmit to Downstream totals
will match as will the Transmit to Upstream and Receive from downstream.
Data columns
The following table explains the data in the columns
| Field | Description |
|---|---|
| ASN | AS Number |
| Name | AS Name – Code as assigned |
| Full name | Full AS Name |
| Volume | Total bytes transferred (MB/GB/TB/PB) |
| Average Bandwidth | Average bandwidth for this traffic flow |
| Uniq AS Path | Unique active routes (need BGP) This is an estimate |
| Uniq Prefix | Unique prefixes (need to configure cardinality counting feature for this) |
| Options | Drilldown options for this AS |
To access, Login as user & Select Dashboard → Show All → Enter ‘Peering Analytics’ in Filter
| Field | Description |
|---|---|
| Time Frame | Select a desired date and time using the custom time option |
| Routers | Select a desired router from the list of available routers |
| Interface | Select an interface associated with the router selected |

Peering Analytics Charts
Every Peer-AS associated to the router and interface in upstream and
downstream can be deeply analysed using the options dropbox.
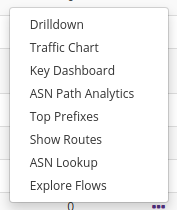
options
Drilldown
Peering Analytics in Trisul provides a deep drilldown of each peer AS to know the Transmit/Recieve from upstream/downstream of the particular peer AS with interfaces.
Refer Peering Analytics Drilldown
Top Prefixes
It provides a list of top 99 prefixes that is associated with the Peer AS.
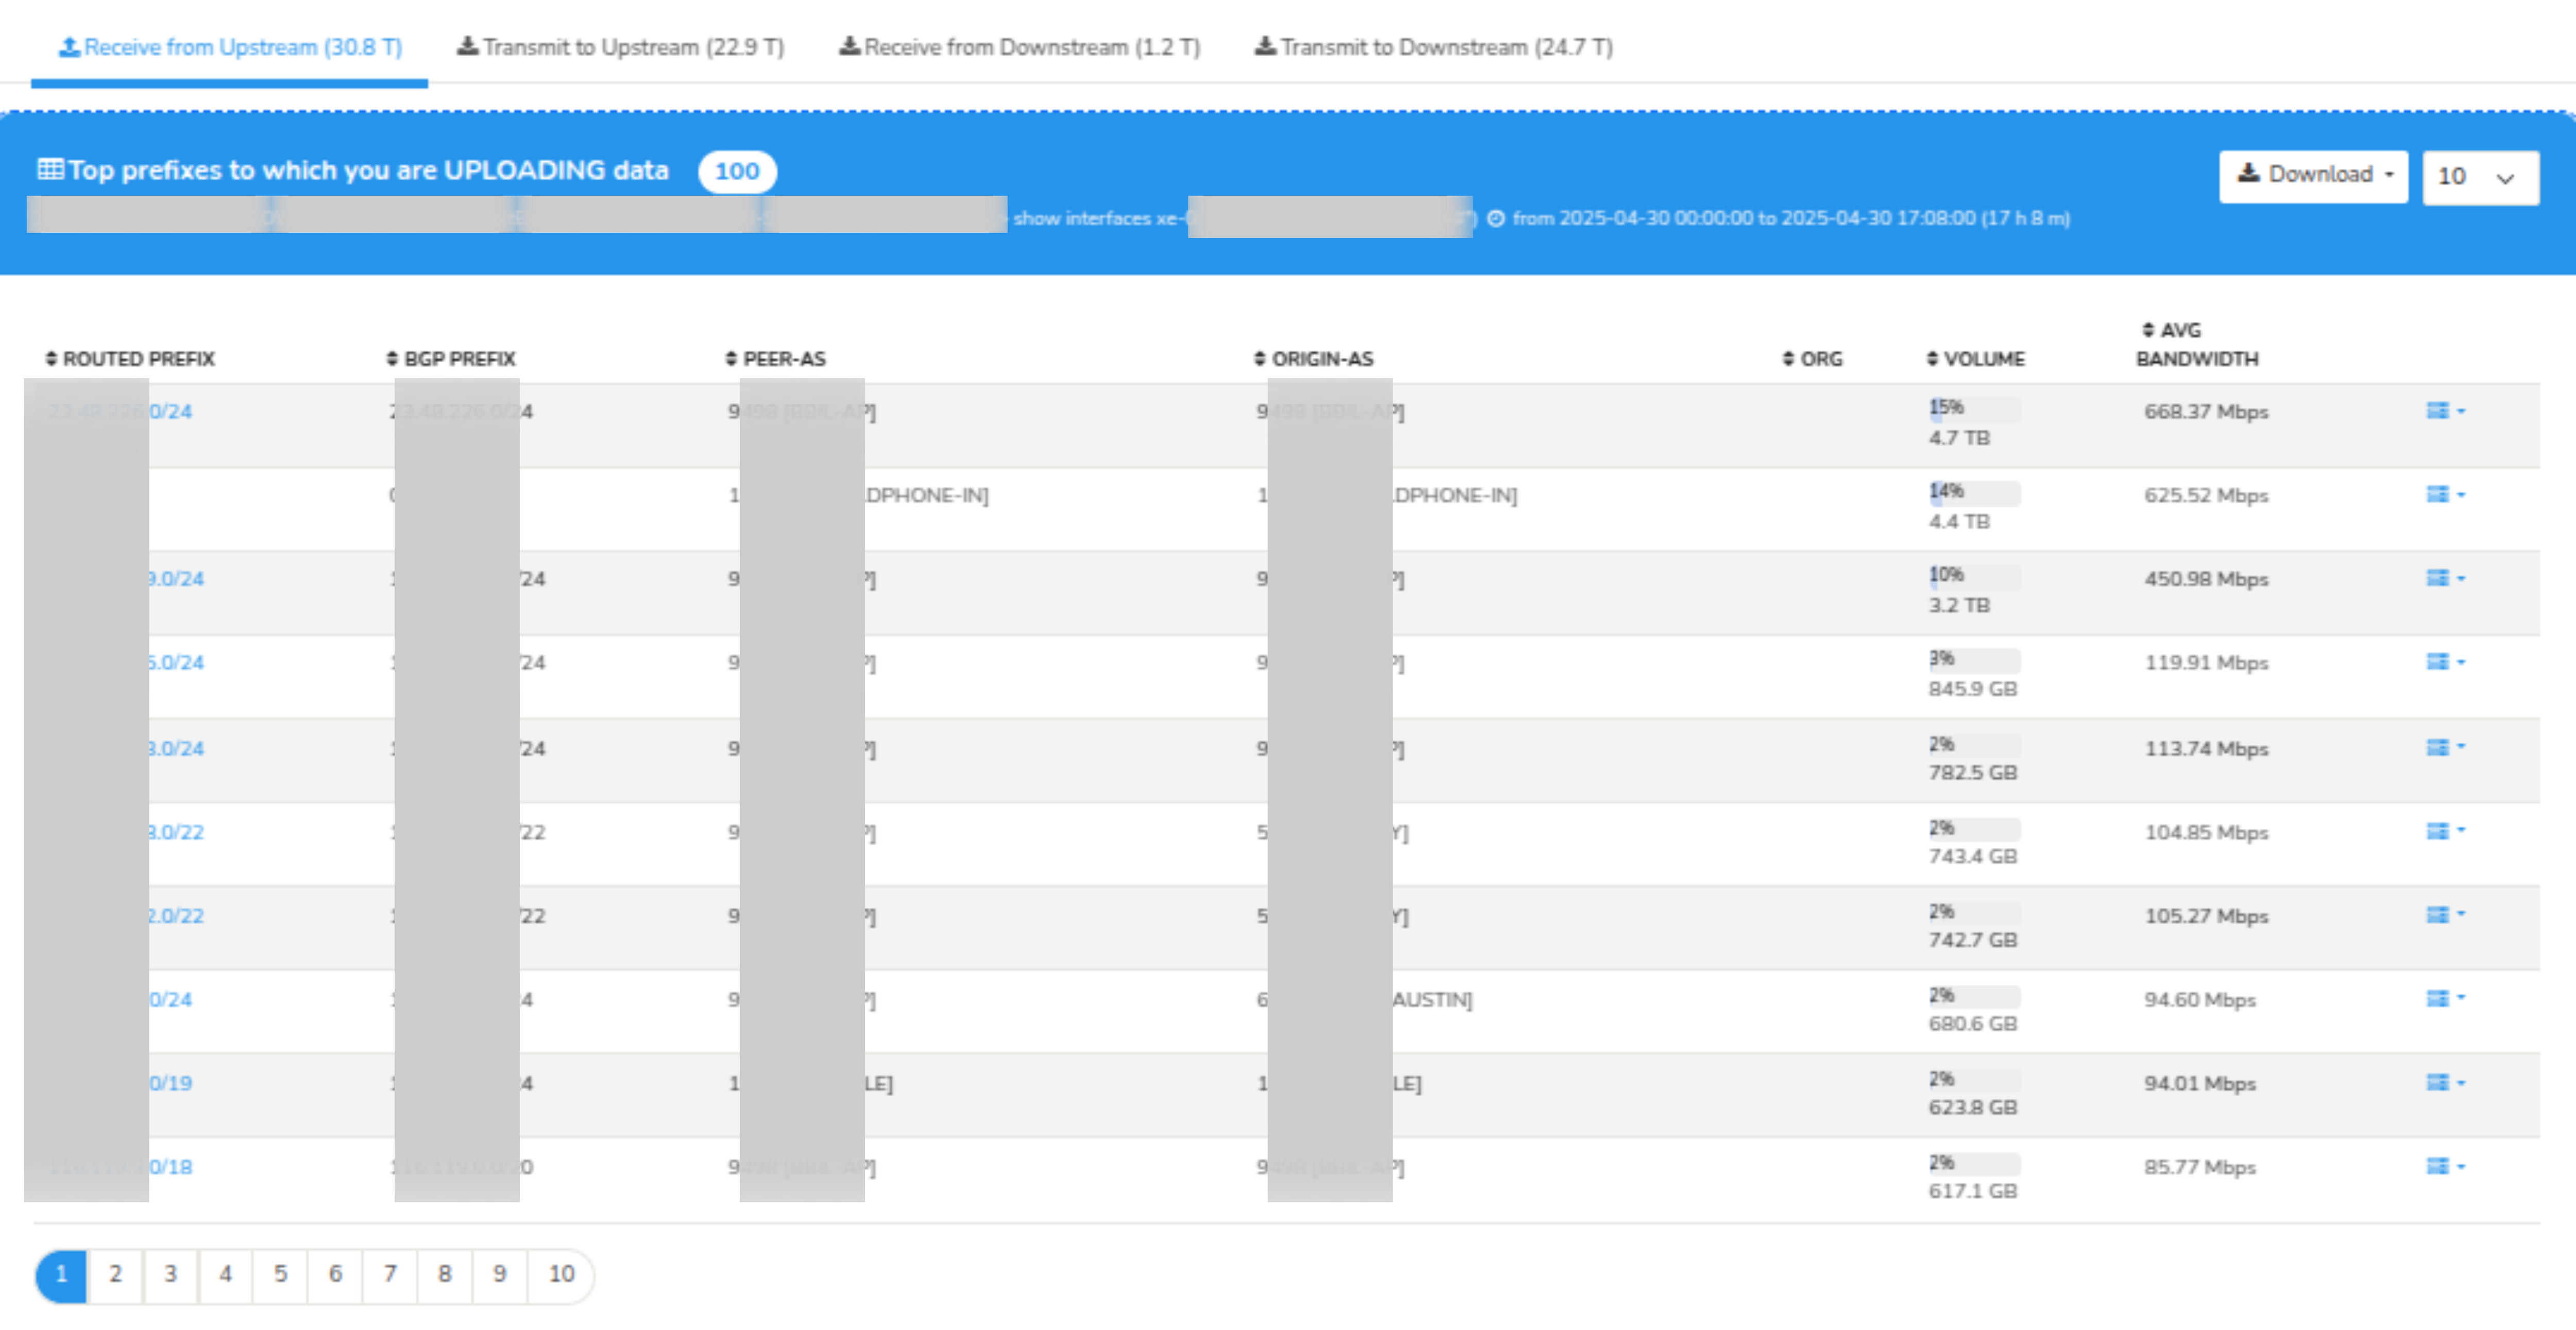
Peering Analytics - Top Prefixes
Explore flows
Explore flows maps every flow that is associated with the Peer AS. To know more about explore flows, Refer Explore Flows
Peering Analytics - Explore Flows
Prefix Analytics
Prefix analytics provides external prefix mappings for routers and interfaces. Your prefixes real time and historical traffic mapped to gateways, next hops, and AS. You can also see external prefixes usage per gateway.
Monitor top prefixes on a per interface basis. Helps with traffic engineering selecting which prefix to announce to which peer etc. Traffic chart provides a pictorial representation of the traffic history of External Prefix x Interface from Upstream/Downstream
Data Columns
The following table explains the data in the columns
| Field | Description |
|---|---|
| Routed Prefix | The prefix as routed will match the route in the RIB of the router |
| BGP Prefix | The prefix matched with the BGP route receiver database.This can be different |
| Peer-AS | IF BGP prefix is found, the peer AS from the BGP route |
| Origin-AS | If BGP Prefix is found, the origin AS from the BGP route |
| Organization | The organization, Trisul has an option of maintaining a separate customer database that contains prefix from one AS but announced by another. Example is Akamai servers announced by an ISP |
| Volume | Total volume (GB/TB/PB) |
| Bandwidth | Avg bandwidth / sec |
| Options | Further options to drilldown into the prefix |
To access, Login as user & Select Dashboard → Show All → Enter ‘Prefix Analytics’ in Filter
| Field | Description |
|---|---|
| Time Frame | Select a desired date and time using the custom time option |
| Routers | Select a desired router from the list of available routers |
| Interface | Select an interface associated with the router selected |

Prefix Analytics Charts
Every Prefix associated with each interface in the upstreams and
downstreams can be deeply analysed using the options dropbox.

options
Drilldown
Prefix Analytics in Trisul provides a deep drilldown of each prefix with interfacea.
Refer Prefix Analytics Drilldown
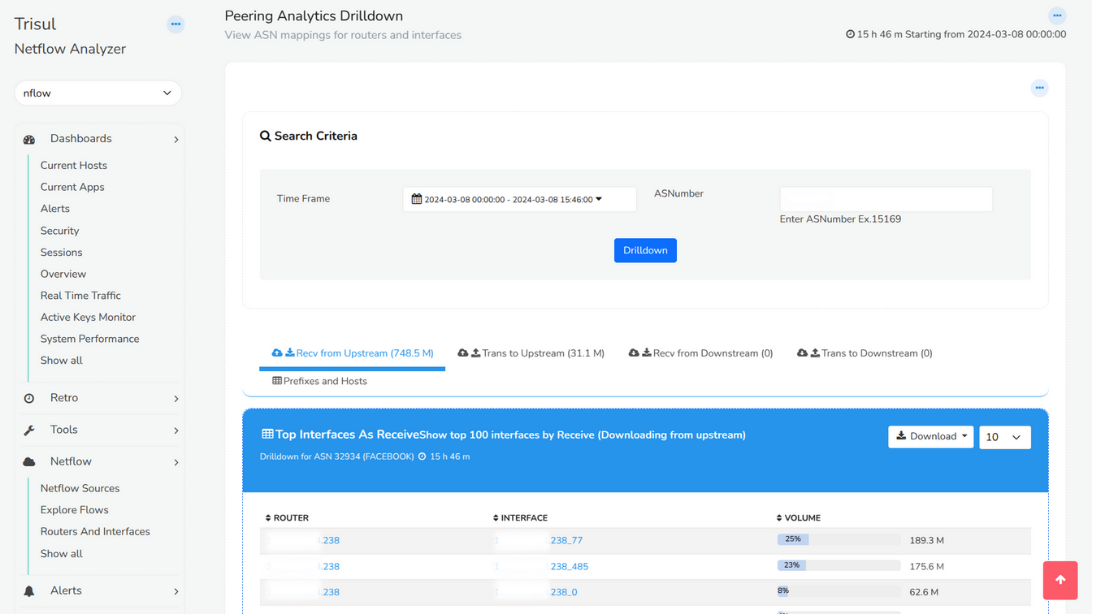
Peering Analytics Drilldown
Peering Analytics drilldown provides deeper analysis of AS with interfaces.
To access, Login as user & Select Dashboard → Show All → Enter ‘Peering Analytics Drilldown’ in Filter
| Field | Description |
|---|---|
| Time Frame | Select a desired date and time using the custom time option |
| AS Number | Enter an AS Number you need to drilldown eg 9498(Bharti Artel) |
 Peering Analytics Drilldown
Prefix Analytics Drilldown
Prefix Analytics drilldown provides deep analysis of a prefix with interfaces.
Track traffic flows for a single prefix in the entire network. Helps with traffic engineering and verification.
To access, Login as user & Select Dashboard → Show All → Enter ‘Prefix Analytics Drilldown’ in Filter
| Field | Description |
|---|---|
| Time Frame | Select a desired date and time using the custom time option |
| Prefix | Enter a prefix you need to drilldown |
you can see four tabs say,
- Receive from upstream
- Transmit to upstream
- Receive from downstream
- Transmit to downstream
- Prefixes and hosts
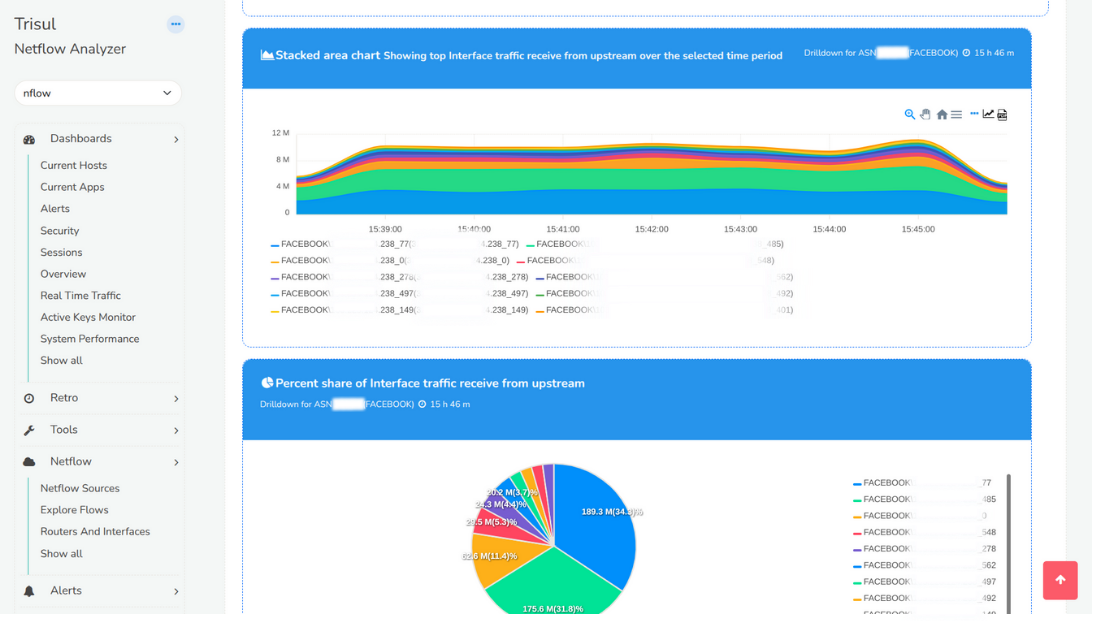
The "receive from upstream" is the analytical insights of Top Interfaces Prefix Received
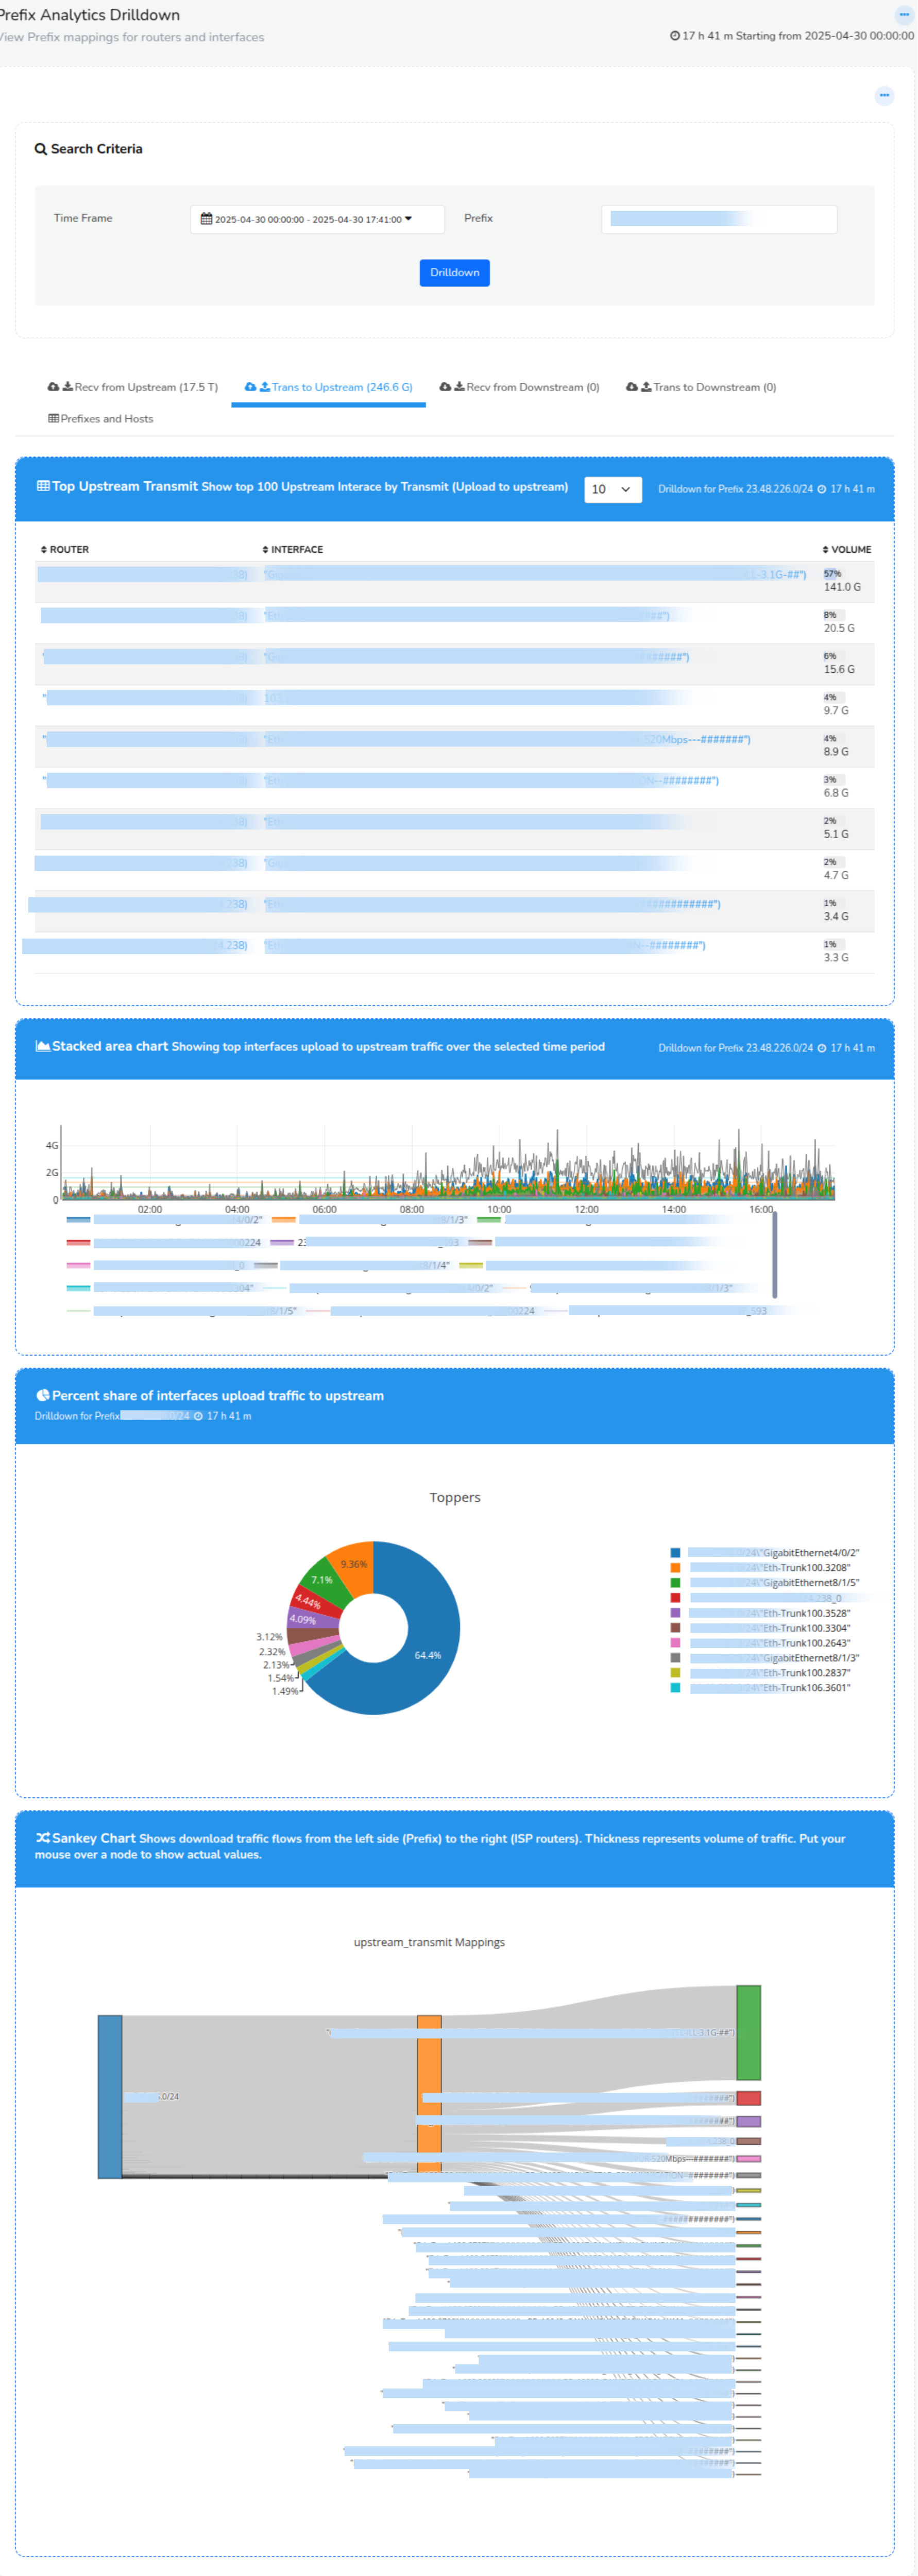
Prefix Analytics Drilldown
Similarly you can click on the concurrent tabs to view their analytical insights.
The "Prefixes and hosts" tab shows the top ASNumbers, top prefixes, top internal hosts, and top external hosts.
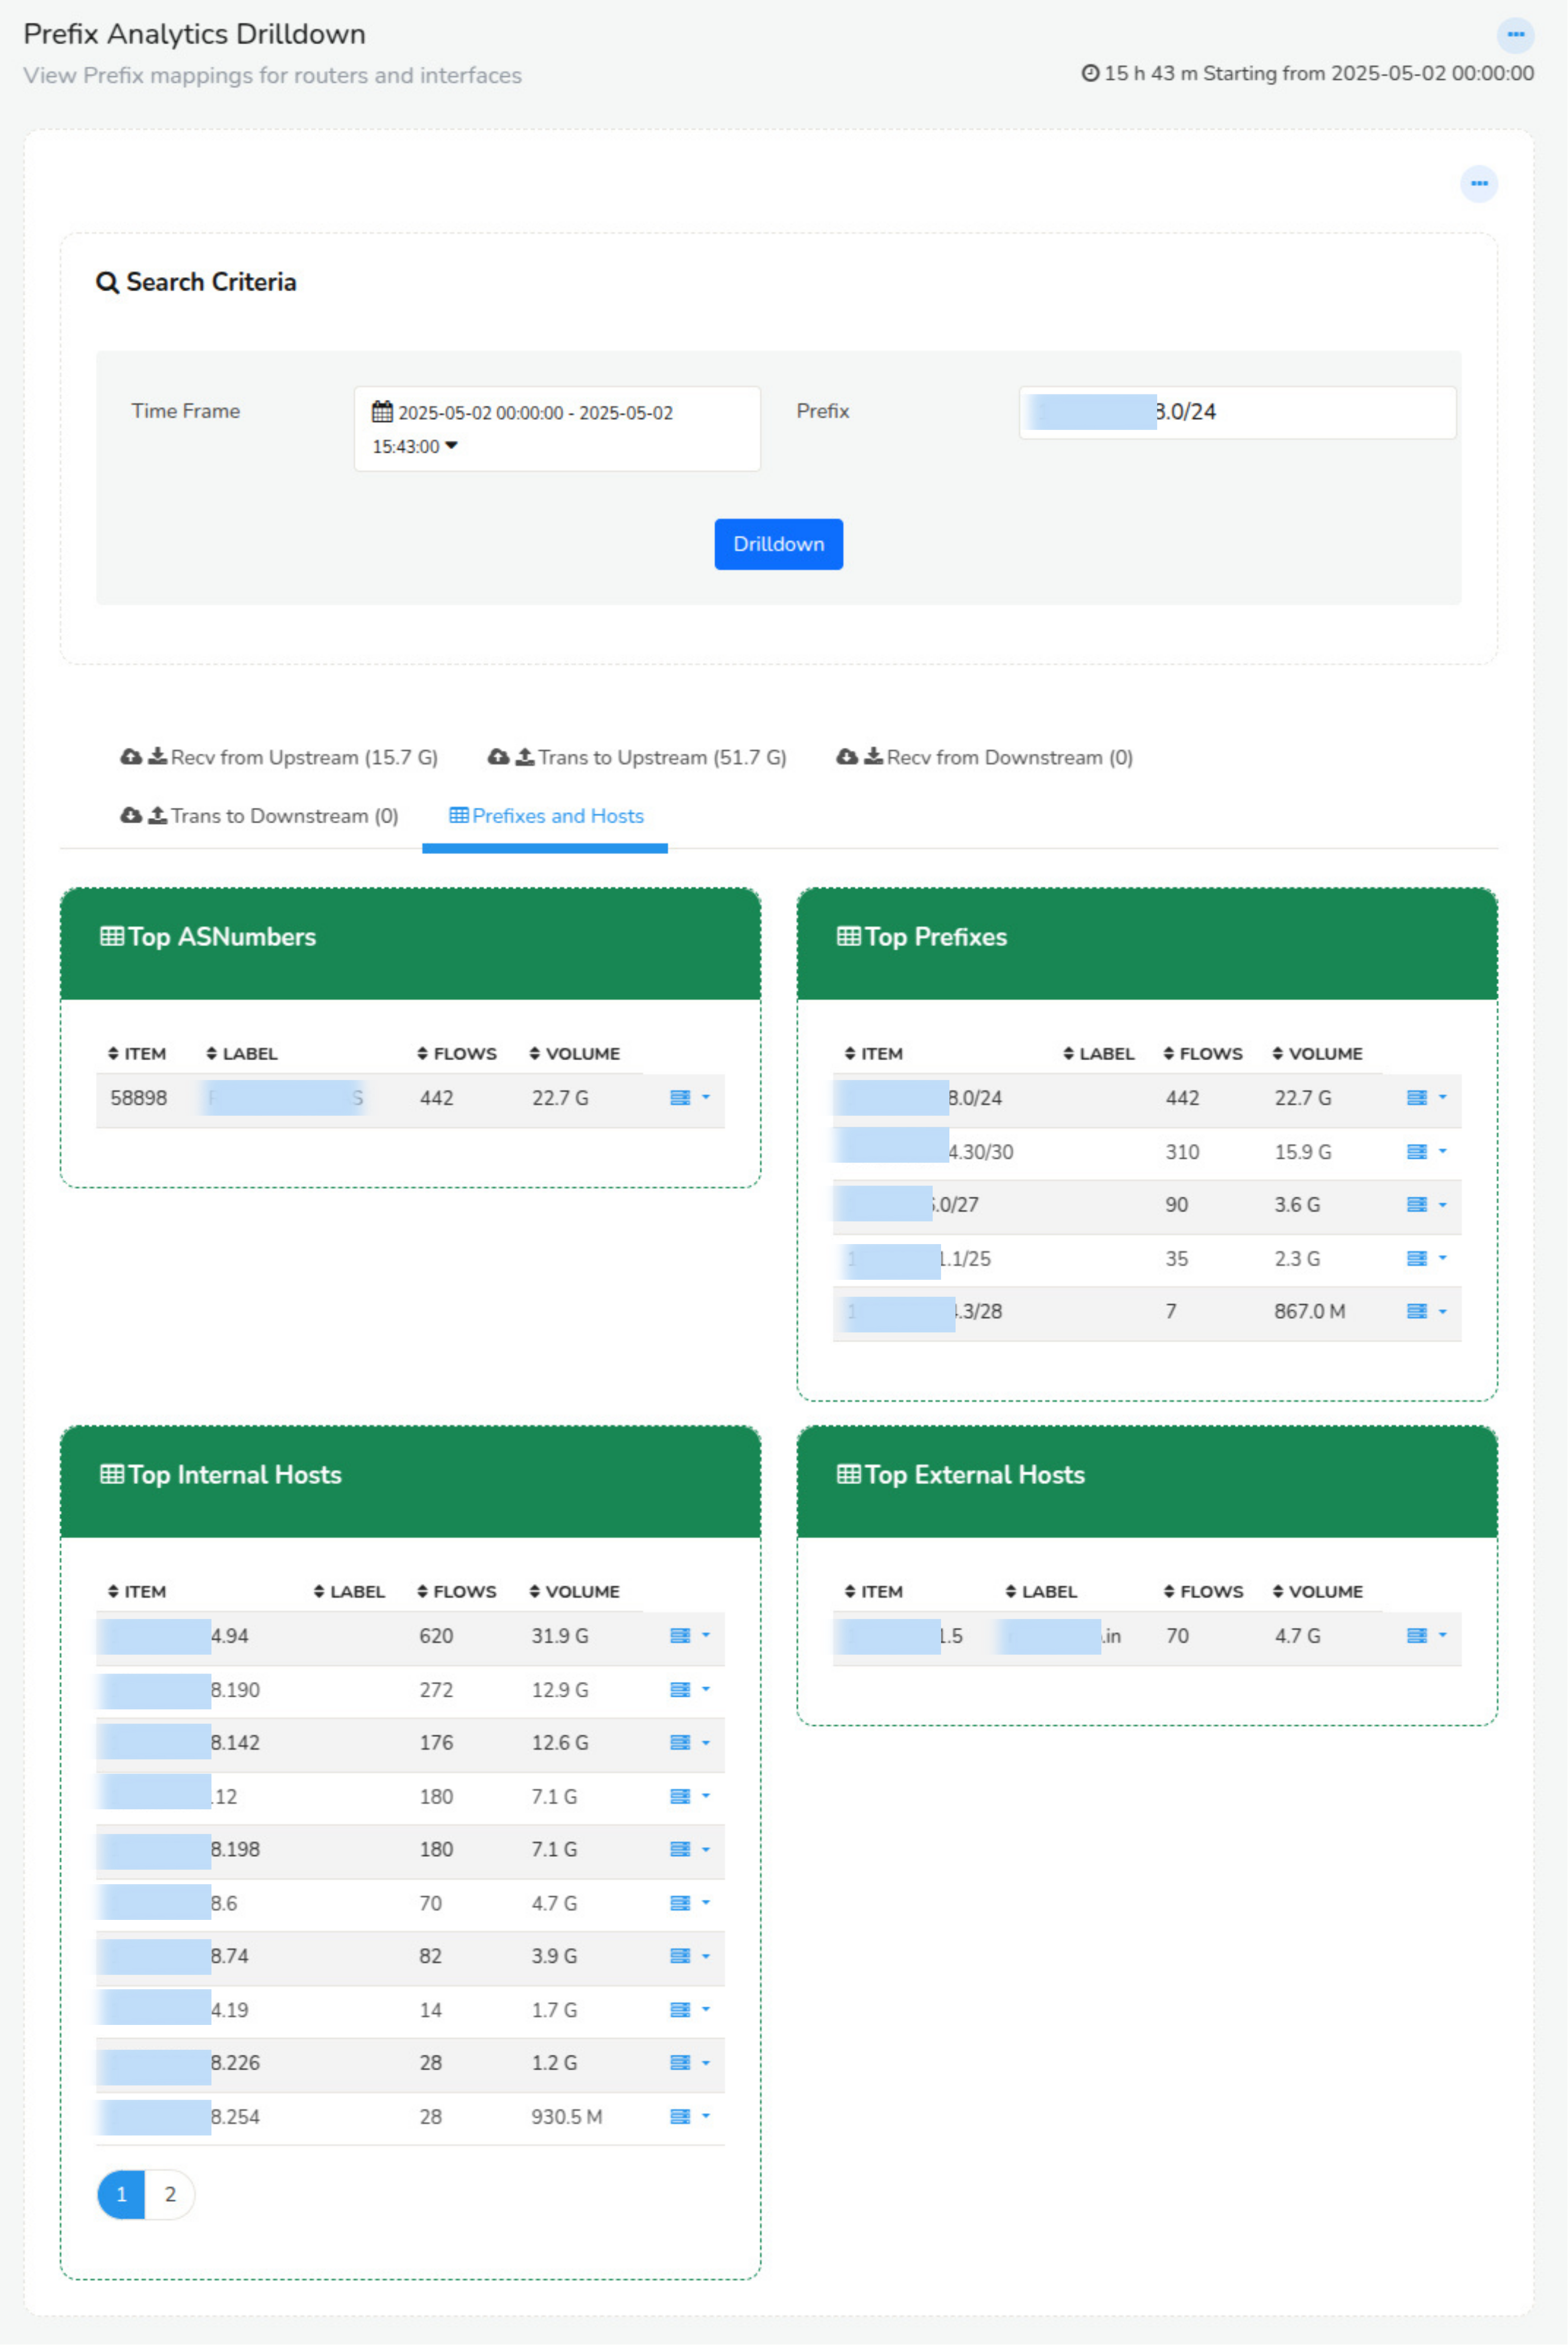
Figure: Showing Prefixes and Hosts
You can click on the option button against each item to further drilldown to
ISP Country Analytics
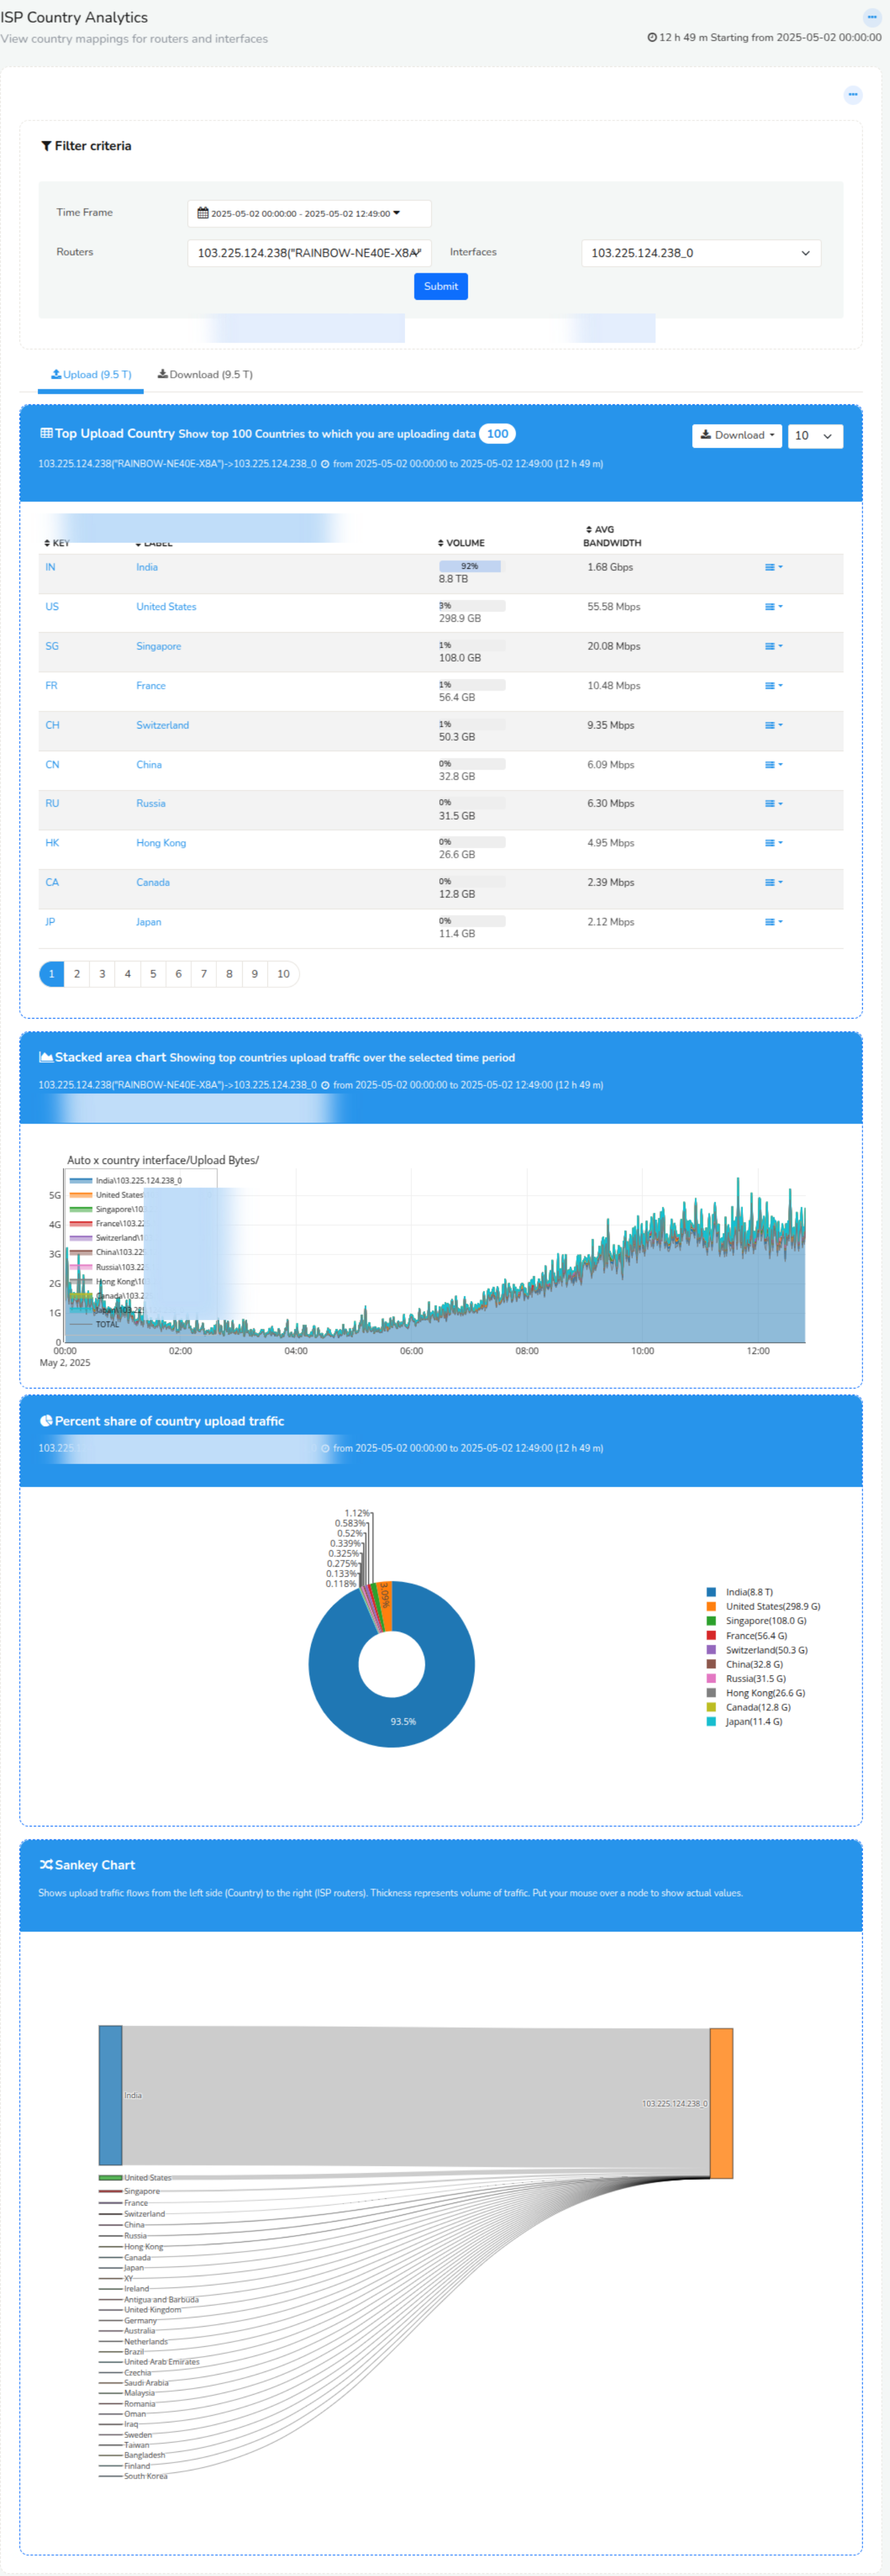
Country analytics provides country mappings for routers and interfaces. Countries real time and historical traffic mapped to gateways, next hops, and AS. You can also see every country’s usage per gateway. Traffic chart provides history of Country x Interface from Upstream/Downstream.
Traffic volumes to different countries. Helps plan gateway locations efficient routing policy.
Data Columns
The following table explains the data in the columns.
| Field | Description |
|---|---|
| Key | The Country Code |
| Label | The name of the country |
| Volume | Traffic upload from this country – when seen in the Upload Tab and top download when seen in the Download Tab |
| Avg Bandwidth | Traffic Bandwidth average for selected time period |
| Options | More options |
To access, Login as user & Select Dashboard → Show All → Enter ‘ISP Country Analytics’ in Filter
| Field | Description |
|---|---|
| Time Frame | Select a desired date and time using the custom time option |
| Routers | Select a desired router from the list of available routers |
| Interface | Select an interface associated with the router selected |
Country Analytics Charts
Every country associated to the router and interface in upstream and
downstream can be deeply analysed using the options dropbox.
Drilldown
Country Analytics in Trisul provides a deep drilldown of each country to know the Transmit/Recieve from upstream/downstream of the particular country with several other interfaces.
Refer Country Analytics Drilldown
Country Analytics Drilldown
Country drilldown provides deep analysis of top countries with interface.
The Geo Country Drilldown helps with providing the analysis of Interface toppers associated with every router.
To access,select ISP Analytics Dashboard → Country Analytics Drilldown
| Field | Description |
|---|---|
| Time Frame | Select a desired date and time using the custom time option |
| Prefix | Enter a prefix you need to drilldown |
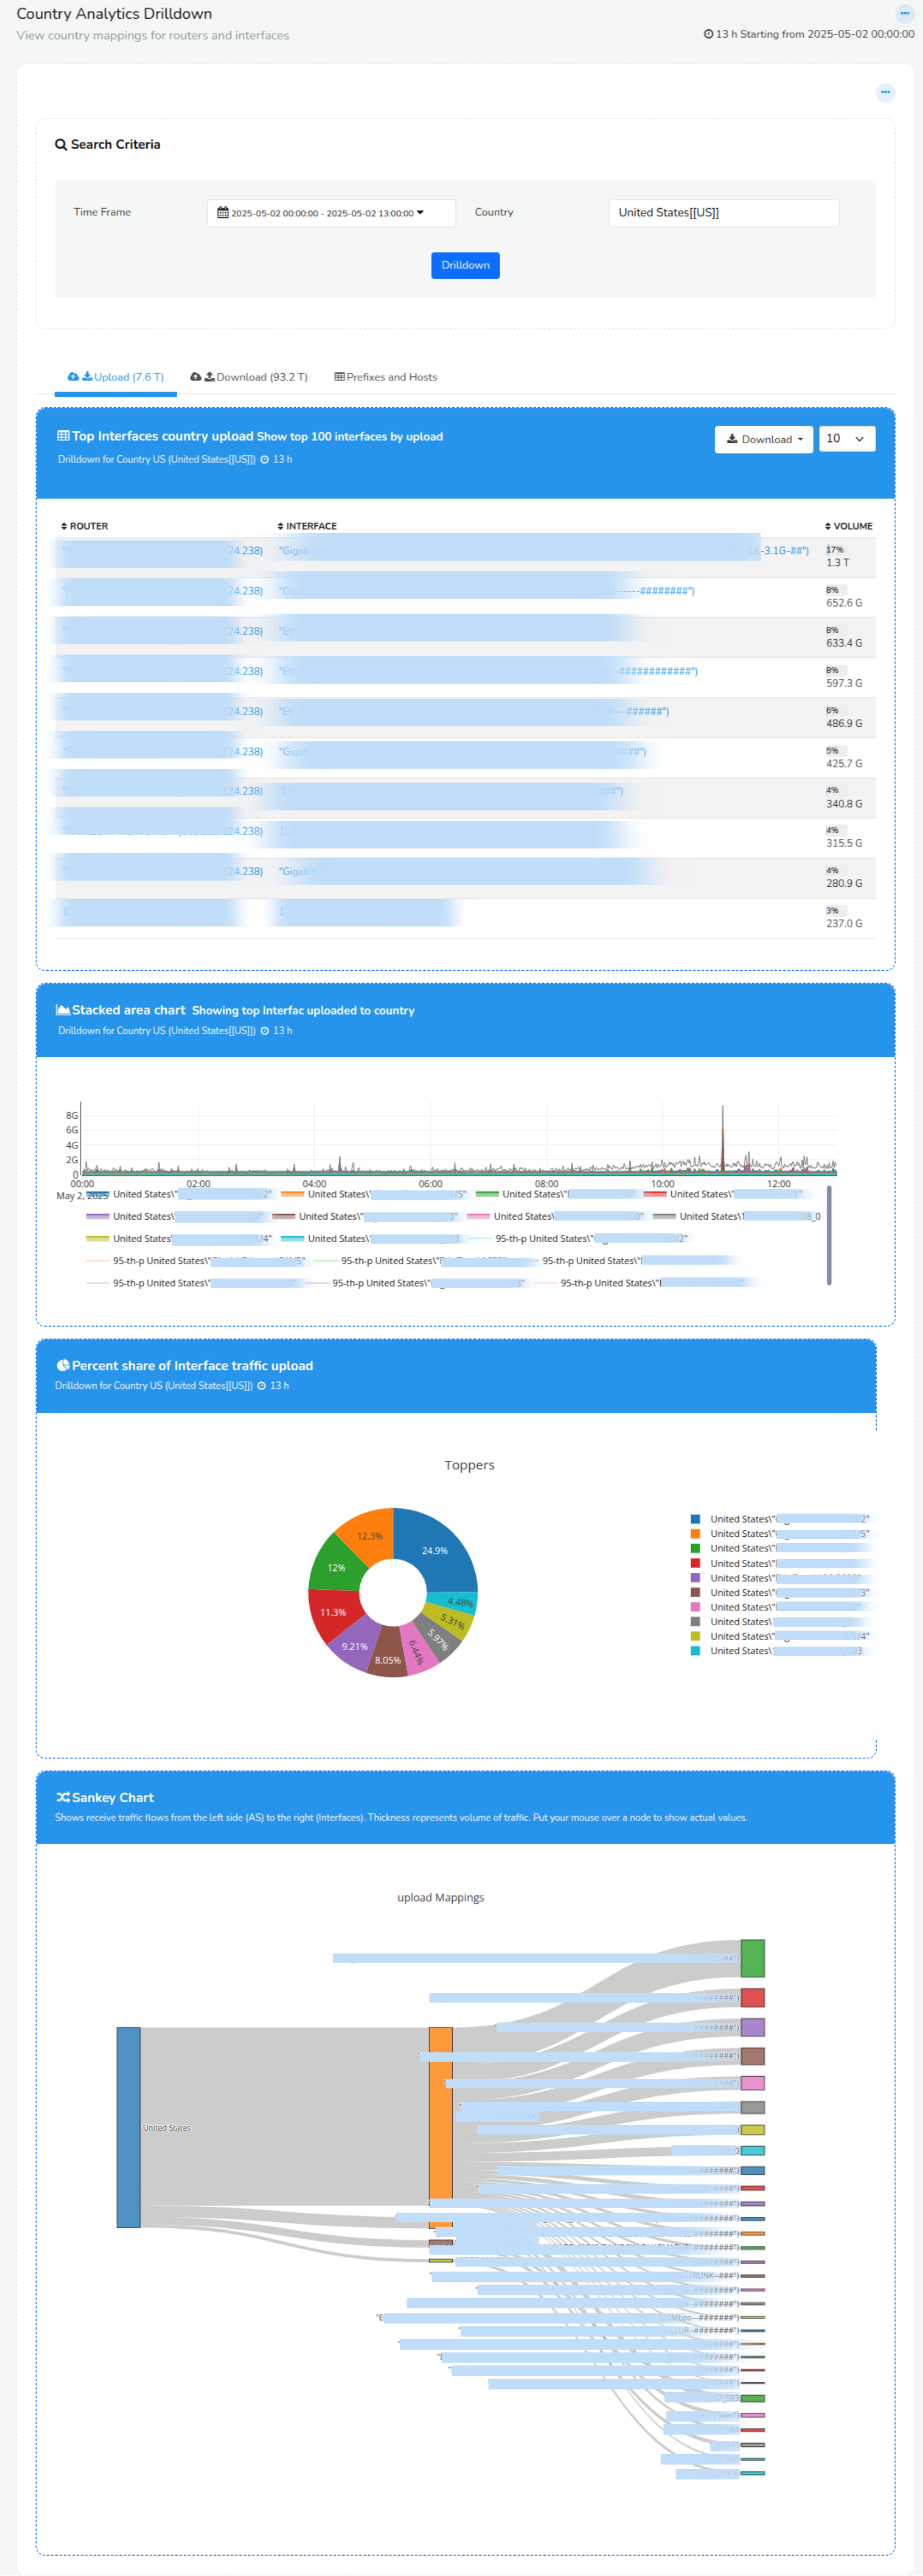
Country Analytics Drilldown
Path Analytics
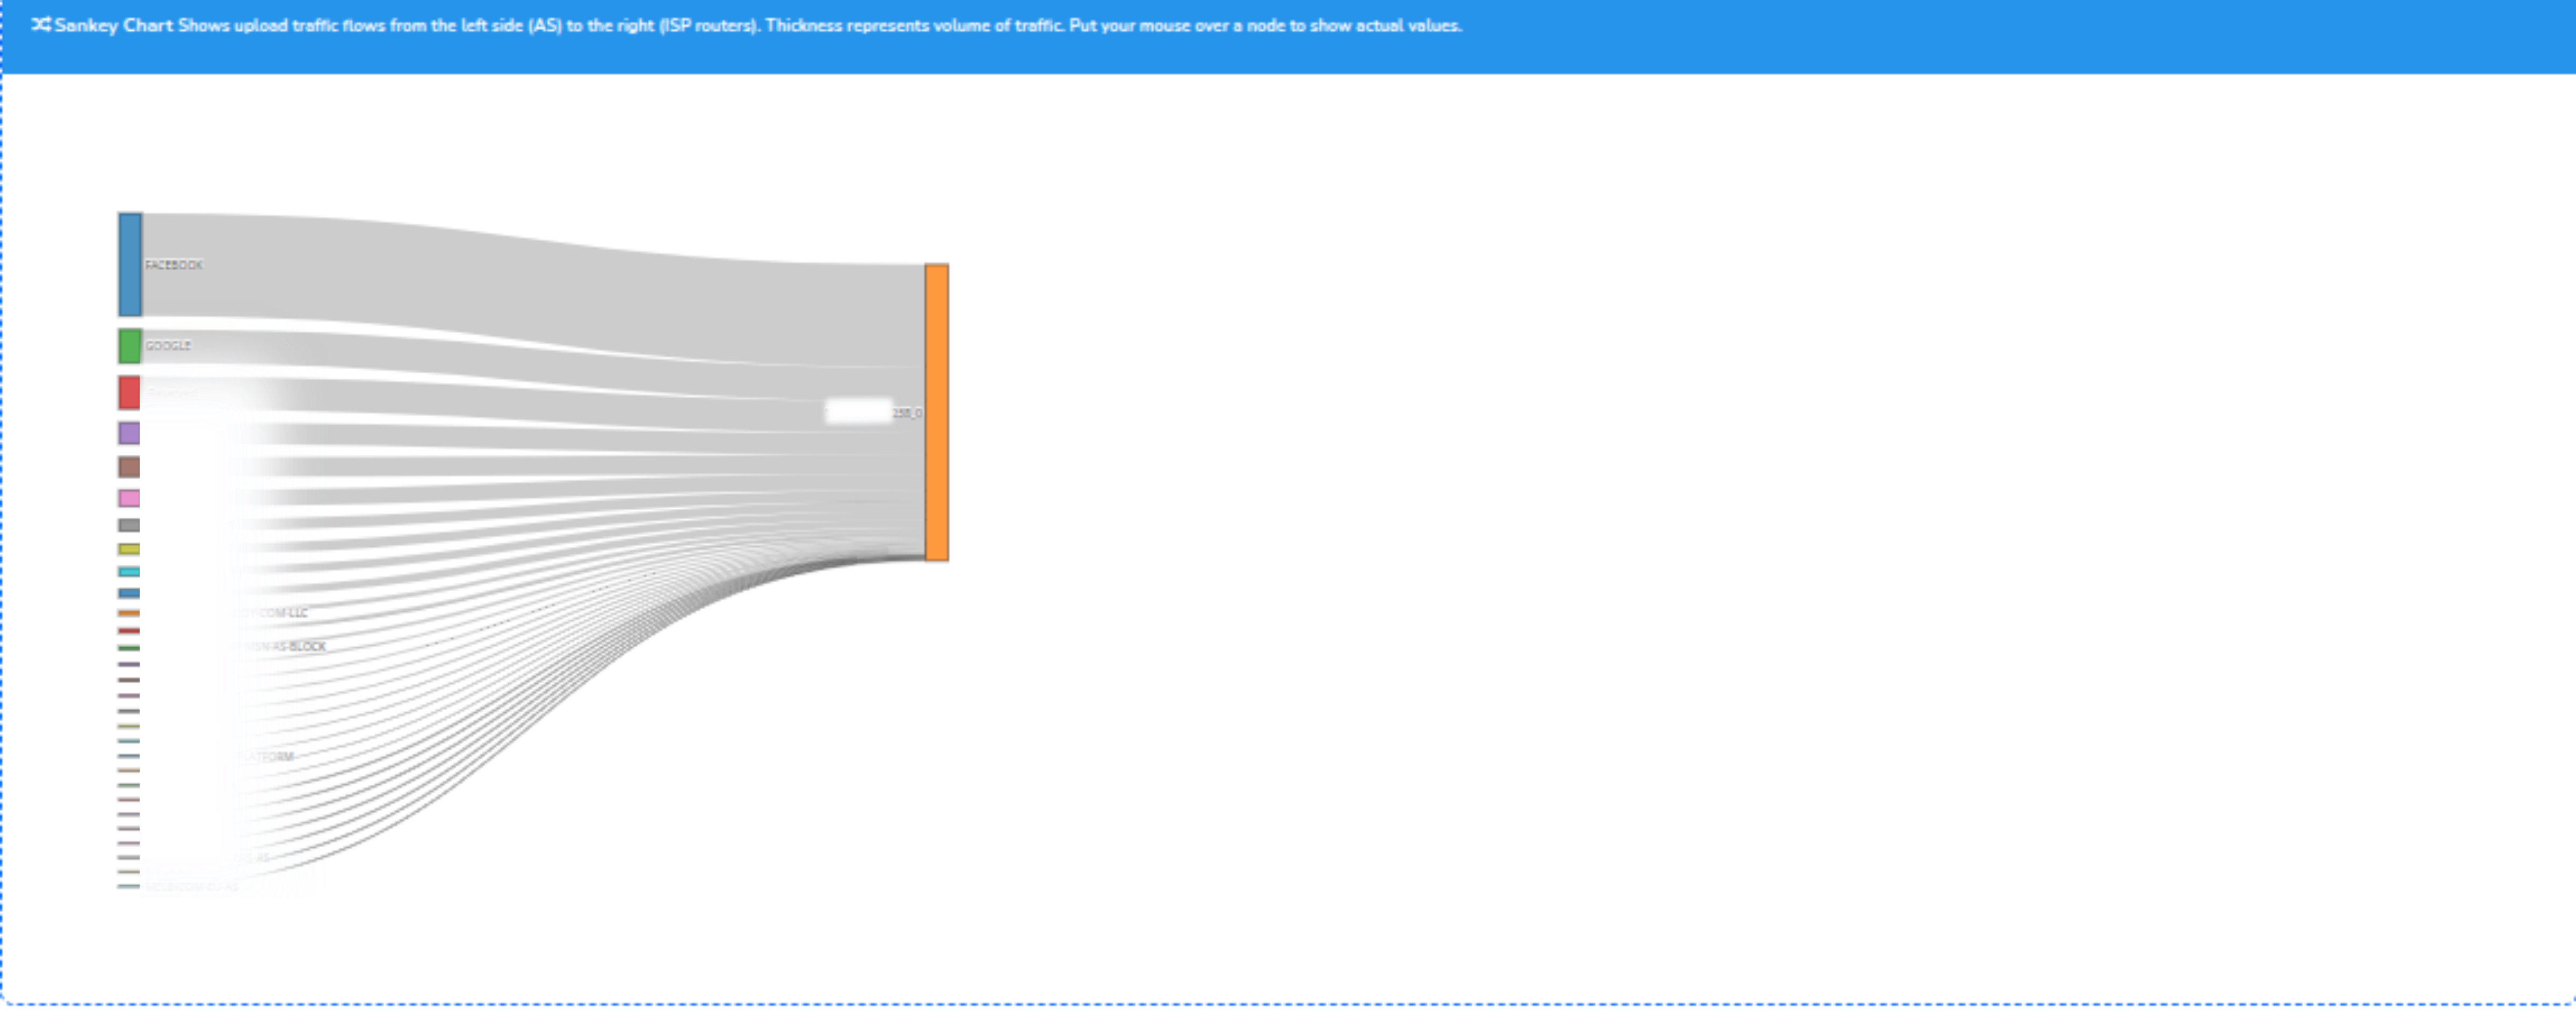
ISP Path analytics Dashboard provides detailed analysis of the Top AS paths.
Monitor top routes in your network and track per hop usage. Helps route capacity planning.
Interpreting Path Analytics Volumes
The path analytics feature is based on collating ASPath information with a router interface. The following diagram explains the details.
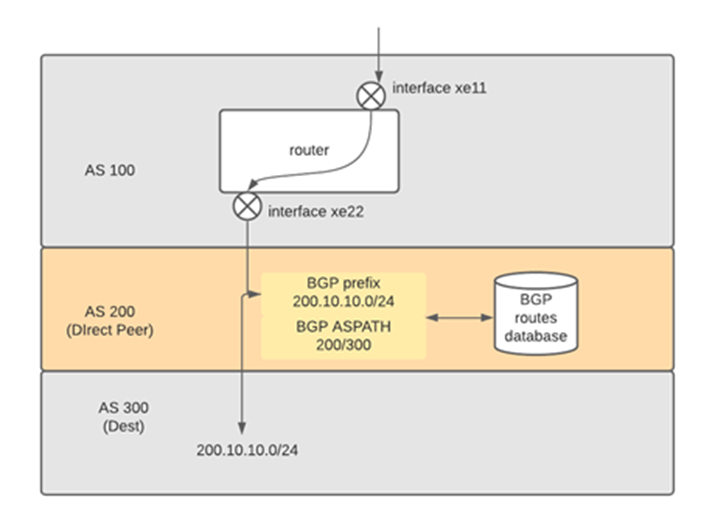
Path Analytics Numbers
The picture shows a flow ingress interface xe11 on upstream then egress xe22 on downstream. The destination prefix is 200.10.10.0/24 and the AS PATH for the egress side is 200/300. The AS 200 is a transit AS. The volume is 1GB. This data is shown in the AS Path analytics as below.
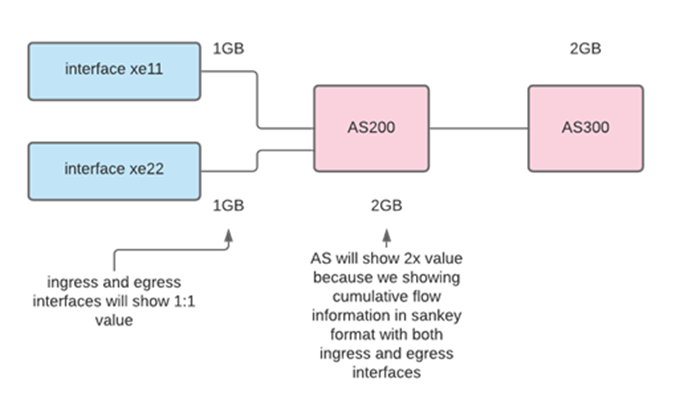
Path Analytics interface vs AS node numbers
APPLICATION NOTE: Note that the interface traffic numbers will be exact but the AS numbers will be 2X because both the ingress interface and egress interface flow are collated. Keep that in mind while interpreting the chart. It is focused on interface -> AS flows, hence the interface numbers are important.
To access, Login as user & Select Dashboard → Show All → Enter ‘Path Analytics’ in Filter.
| Field | Description |
|---|---|
| Routers | Select from a list of available routers |
| Interface | Select an interface associated with the selected router |
| Time Frame | Select a time frame from the custom time menu |
| Filter ASN | Enter an AS Number to filter result, eg.9498 |
| Remove Toppers | Remove the top N flows from view to reveal the smaller flows |
| Show max nodes | Show approximately these many nodes on the sankey (default 30) |
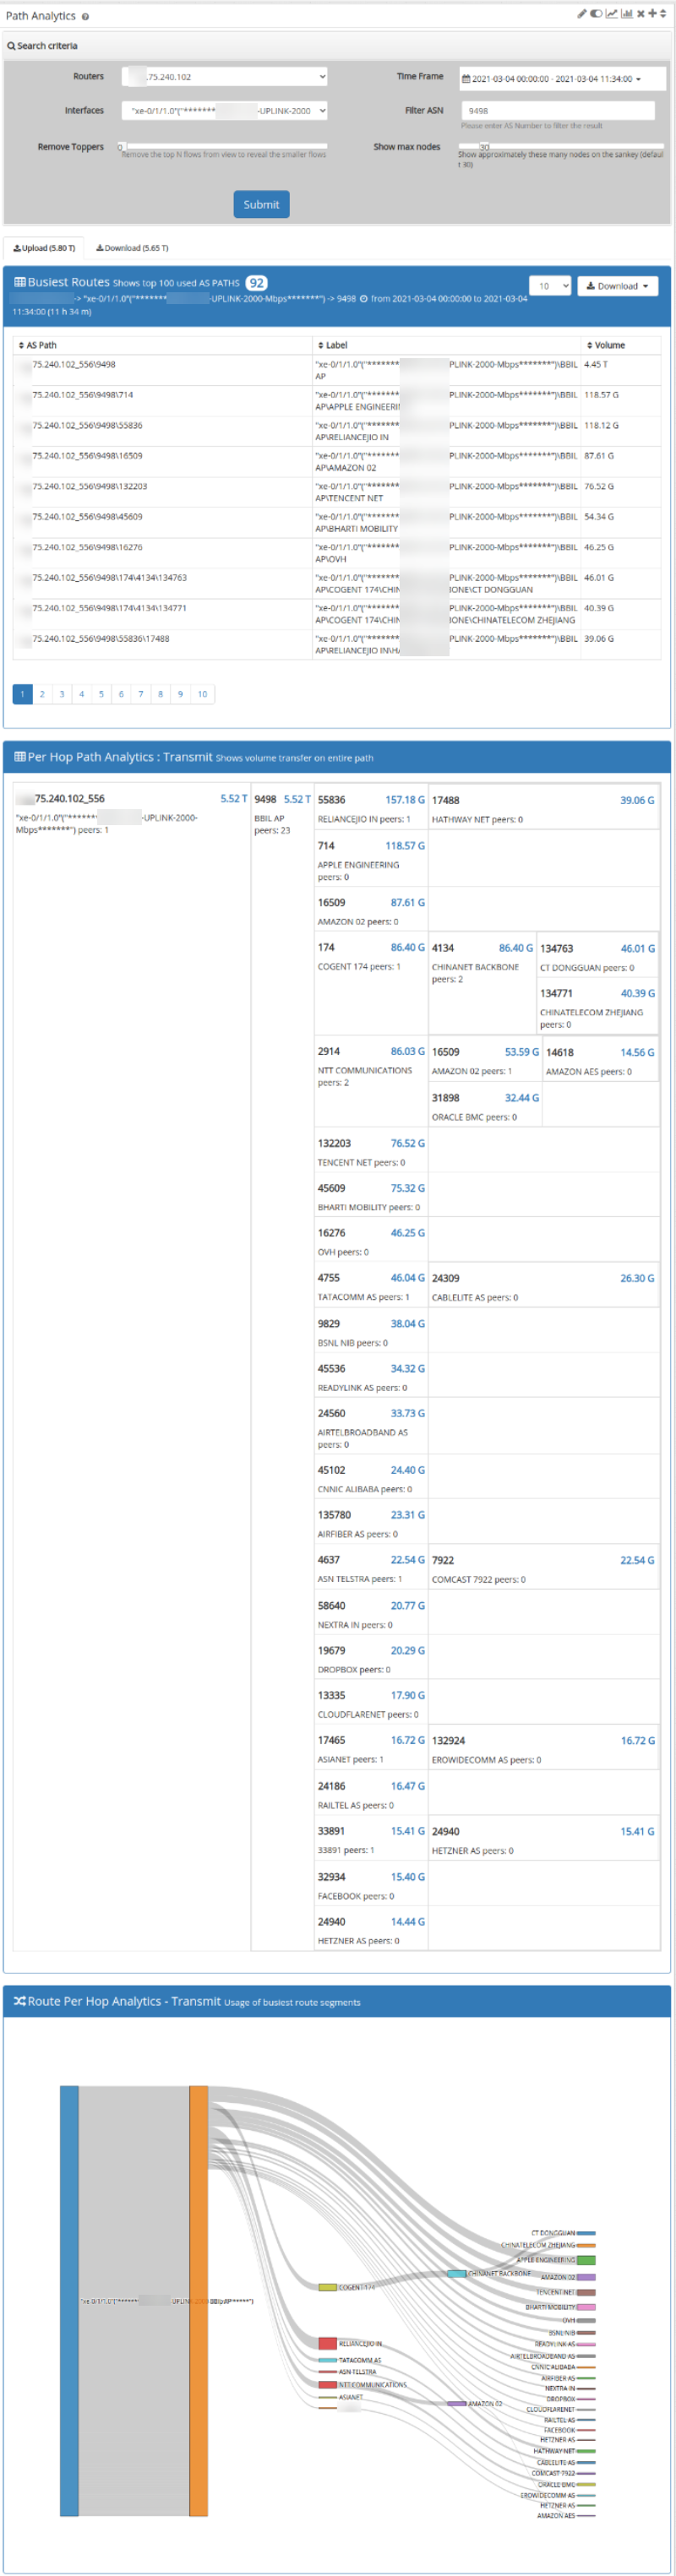
Path Analytics
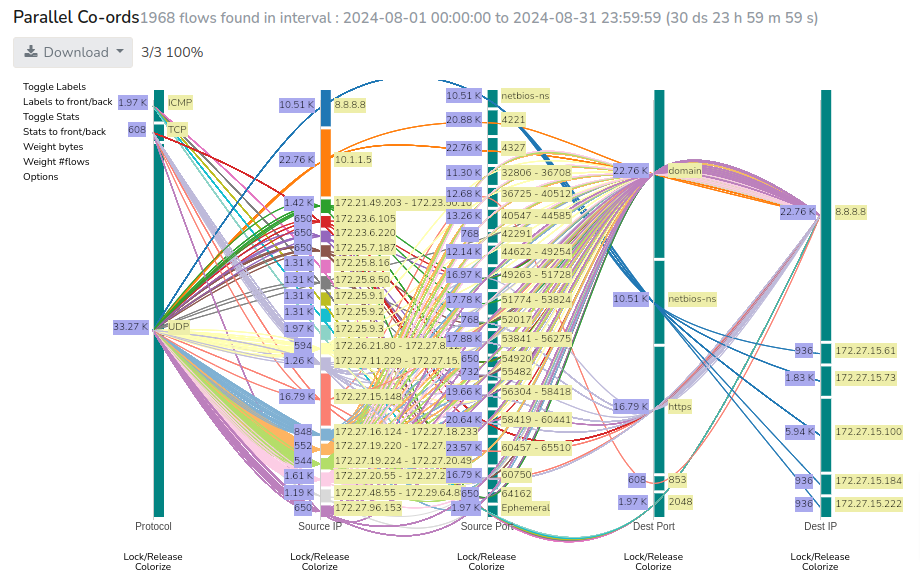
Sankey Crossdrill
Sankey crossdrill is a Crosskey feature that provides sankey charts by matching a cross-key filter with any metric.
Cross keys allow you to create any mapping from X to Y. For example you can create a Cross Key counter group by merging “Internal Hosts of ISP-Peer” to “Flow-ASN” counter group. This will then track Internal IP to ASN flows. This dashboard helps you view the Sankey diagram for such counter groups.
To access, Login as user & Select Dashboard → Show All → Enter ‘Sankey Crossdrill’ in Filter
| Field | Description |
|---|---|
| Counter Group | Select a desired cross-key counter group |
| Meter | Select a desired metric |
| Time Frame | Select a time frame from the custom time menu |
| Remove Toppers | Remove the top N flows from view to reveal the smaller flows |
| Filter Item | Type text to filter crosskey items |
| Show max nodes | Show approximately these many nodes on the sankey (default 30) |
| Inverse Filter | Shows all traffic except the filter item |
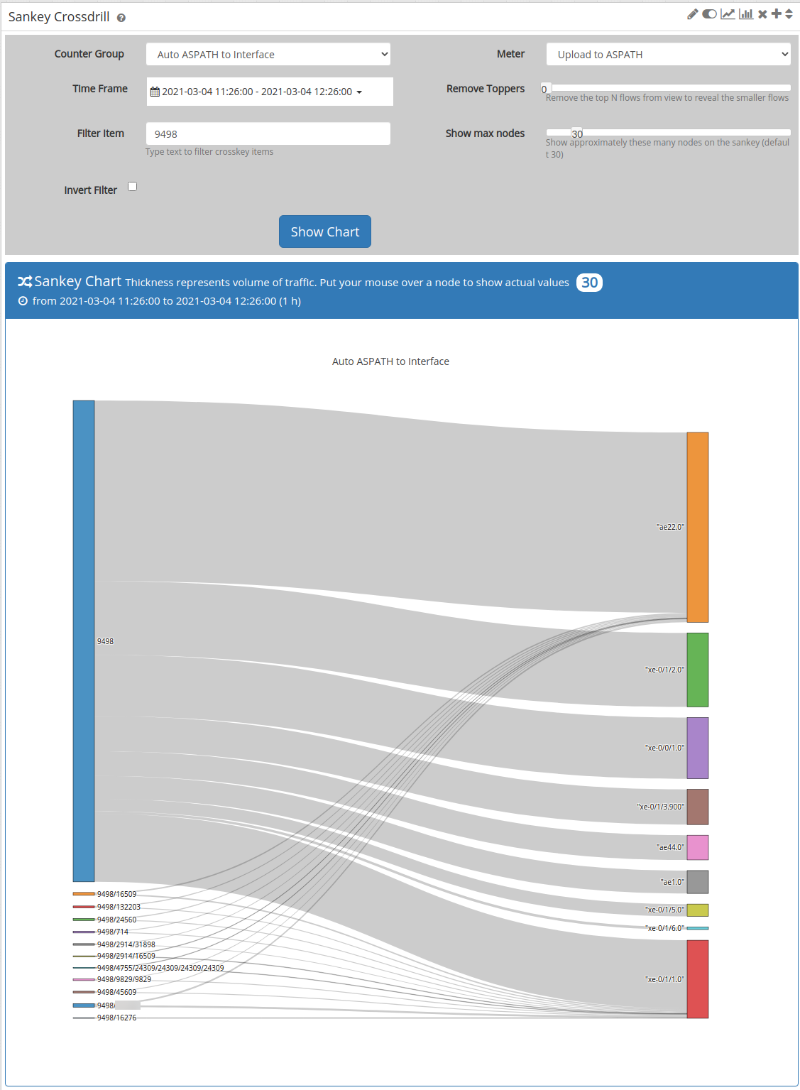
Sankey Crossdrill