Key Dashboard
The Key Dashboard is like a hub that allows you to dive deeper into a specific Key's data and explore related analysis paths. It's a powerful tool for investigating and understanding network traffic in Trisul. Clicking on any key in a dashboard will take you to the Key Dashboard of that particular key.
A quick recap of the hierarchy and terminology first:
-
CounterGroup is a collection of related counters that measure specific aspects of network traffic like hosts.
-
A Key is a unique identifier that defines a specific counter within a CounterGroup. For example, google.com.
-
A Meter is a single counter that measures a specific aspect of network traffic, such as upload bytes, packets, or number of connections.
For more read Traffic Metering Concepts
How to Access the Key Dashboard
There are two ways to get to the key dashboard
1. By Clicking
Click on any Key on any dashboard in any page to open the Key Dashboard for that Key
Some examples :
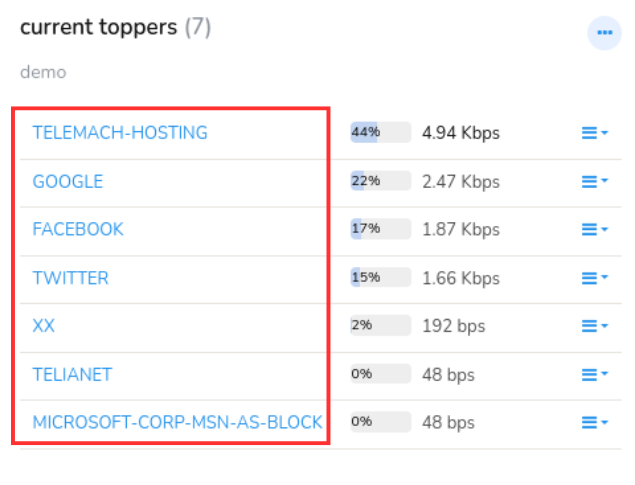 | All ASNumbers are linked to their respective key dashboards |
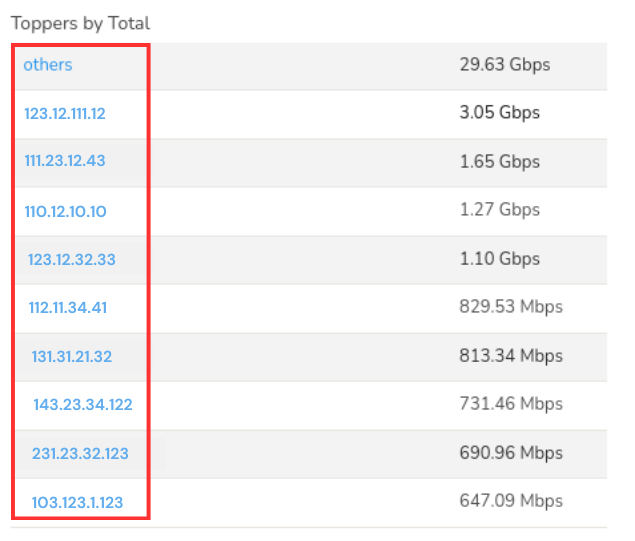 | All hosts are linked to their respective key dashboards |
Figure: Showing Keys on Dashboards for Different Counter Groups
Note that you can also click on PIE and BUBBLE chart items.
2. By Searching
Type in a search item and click on search results
The search method is very useful if you want to see details of something
that is not visible on any of the screens shown by Trisul. For example :
You want to search for a host mail.trisul.org but it isnt showing up
on any lists for you to click on.
Using the Key Dashboard
The default key dashboard has the following modules. Here is a brief description of each of these modules. They are mostly self explanatory.
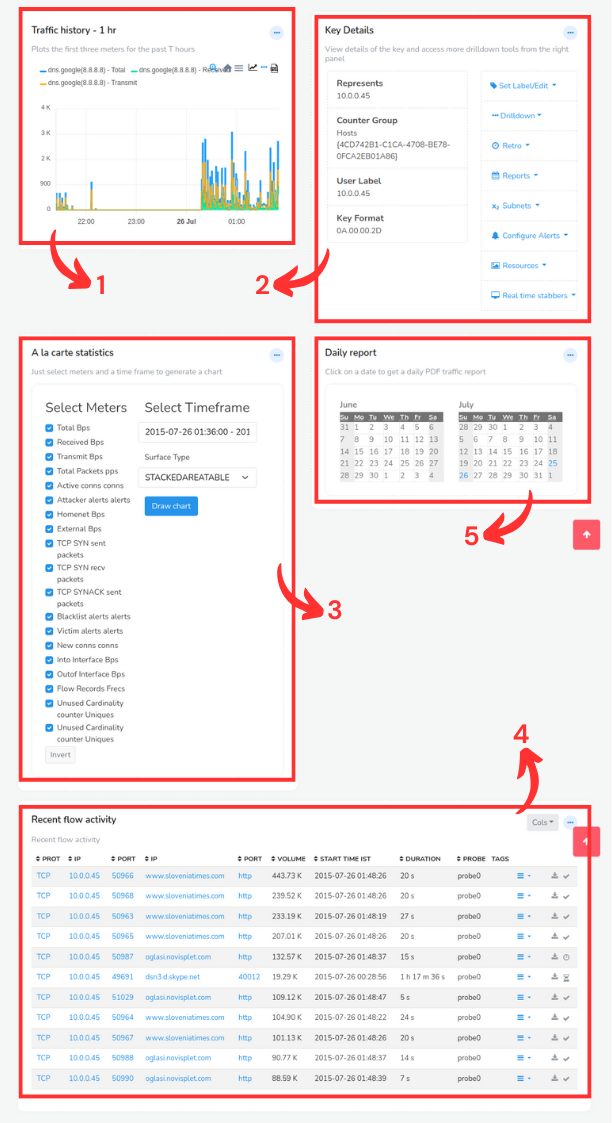
Figure: Key Dashboard Components
| Module | Usage |
|---|---|
| 1) Traffic History | Most recent 1hr traffic history |
| 2)Key Details | Various drilldown options pertaining to this key |
| 3) A la carte statistics | Flexible charting tool (quick and easy) |
| 4)Flow Activity | Displays recent top flows |
| 5)Daily Report | Click on a calendar day to get a PDF report with detailed usage |
| TCA Details | Shows recent threshold crossing alerts, if any |
-
Traffic History
With Traffic History module you can view the amount of data total, transmitted or received over a specific period for that particular Key. The most recent one hour traffic history can be drilled down in more detail over different time points.
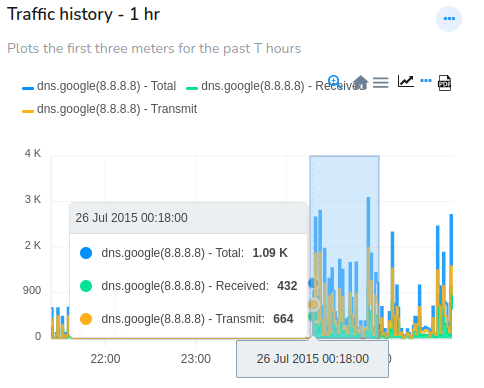
Figure: Traffic History Module in Key Dashboard
-
Key Details
Lets pay special attention to the Key Details module. This is the jumping point where you have access to various drilldown tools related to the key.
This module is split into two panels.
- Info on the left → Contains details about the key
- Tools on the right → Drilldown tools for further investigation about key
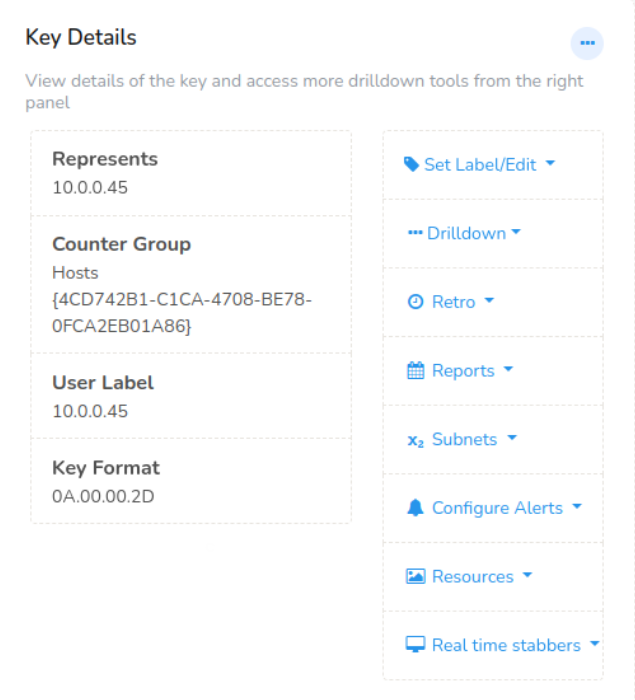
Figure: Key Details in Key Dashboard
The information on the left includes,
-
Represents: Represensts the IP address
-
Counter Group: Information on which counter group of the key
-
User Label: This is the tag name assigned to the particular key
-
Key Format: This is the hexadecimal of the key
Tools on the right side are already existing menus from home page available here handily for investigation of the key.
Set Label/ Edit
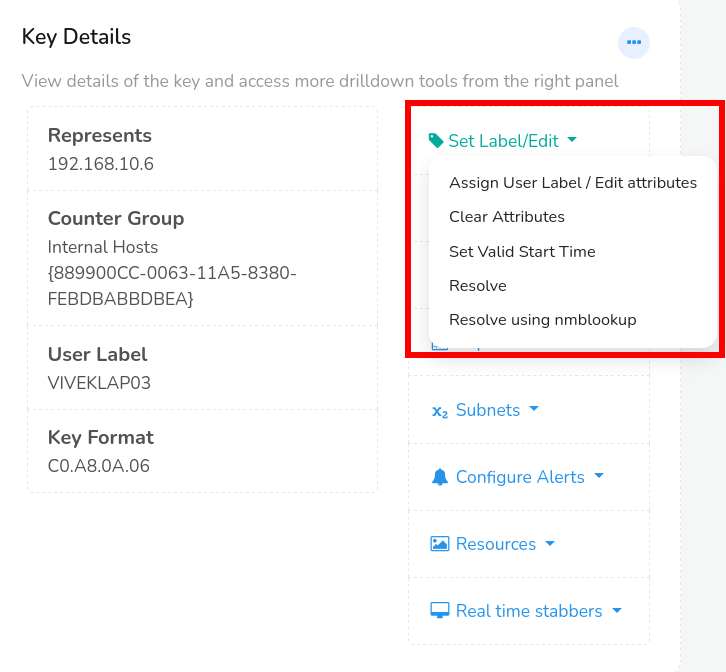
Figure: Set/Edit Label from Key Dashboard
-
Assigning a user friendly name such as a hostname to an IP is a common operation. Click on Assign User Label/Edit attributes if you want to change the label name, description, or edit attributes and click update. See the resolve name section for more details.
-
Click Clear attributes to clear the attributes of the key.
-
Click Set Valid Start Time to set start time for the key.
-
Clicking on Resolve, and this resolves the name for this key. Works for all IP addresses and AS Numbers.
-
You can click Resolve using nmblookup, to resolve names using nmblookup. nmblookup, a part of samba suite resolves NetBIOS names (example, computer names) to IP addresses
Drilldown Options
The contents shown here depend on the type of key being displayed
The most common ones are described below.
| Menu | Description |
|---|---|
| Host Conversations | Shows the Raw Flow conversations of the selected Key |
| Aggregated Flows | Shows the aggregated conversations like top 10 source IPs, top 10 destination ports etc. |
| Alerts | Shows the alerts found in the selected Key |
| Traffic Chart | Shows the traffic chart of the particular Key selected |
| Long Term Charts | You can view the historical usage. Opens up the Long term analysis tool |
| View Edge Graph | You can view the relationships between different network entities such as hosts, protocols, IP addresses etc as a graphical representation. |
| Download PCAP | Download a PCAP file related to this Key |
| Detailed Activity | What is this station doing ? Open up the Investigate IP tool for this key for the last 1 hour. |
| Query Flows by Tag | Filter and analyze network traffic based on specific tags or labels.These tags can be assigned to network flows like sequences of packets based on various criteria, such as: - Protocol (e.g., HTTP, FTP, SSH) - Port numbers etc. The filtered flows are displayed, showing detailed information about each flow |
| Aggregate Flows by Tag | Group and summarize network traffic based on specific tags or labels. |
Subnets
#In /24 → Find active 24 subnet keys in past traffic
#In /22 → Find active 22 subnet keys in past traffic
#In /16 → Find active 16 subnet keys in past traffic
-
A La Carte Statistics
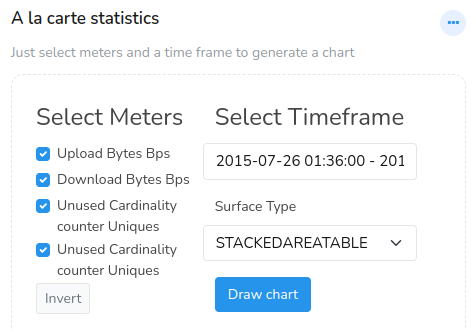
Figure: A La Carte Statistics in Key Dashboard
With A La Carte Statistics you can select specific statistical metrics, select a time frame, and a chart surface you prefer and click Draw chat. This displays a personalized view on your dashboard.
-
Flow Activity
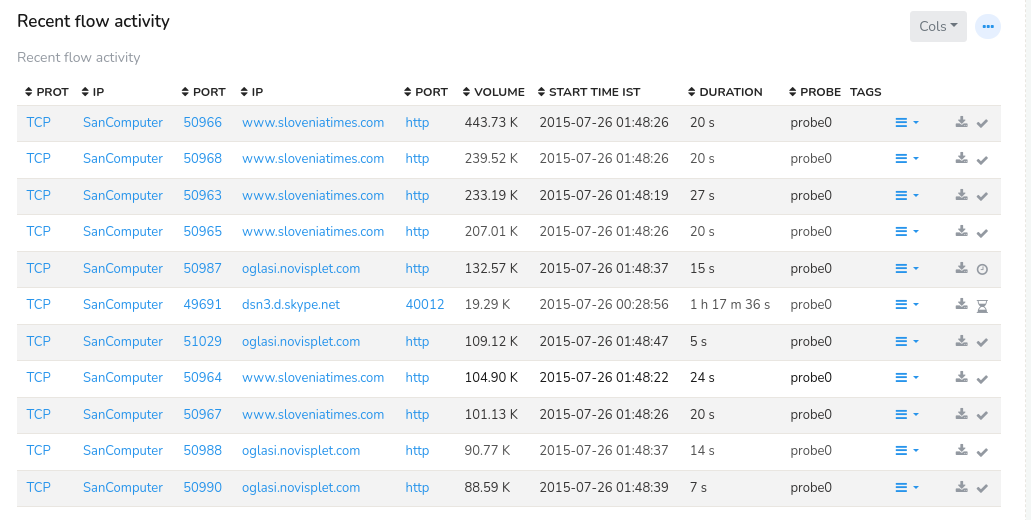
Figure: Recent Flow Activity in Key Dashboard
With Flow Activity you can gain insights into network traffic details like Protocol, Source IP, Source Port, Destination IP, Destination Port, Volume, Start time, Duration, Probe, Tags, Packet Capture available for that item and Flow State. Each Flow can be further filtered using the three lines option button against each flow.
-
Daily Report
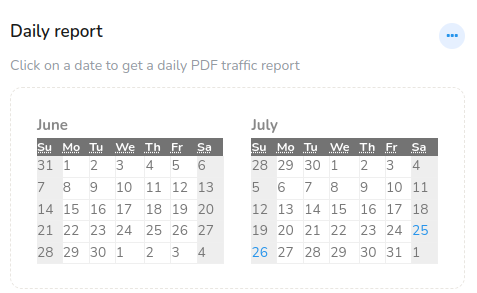
Figure: Daily Report Module in Key Dashboard
You can click on any date on the daily report module and get the traffic report for that date in PDF format.