Show All
👉 Go to NetFlow → Show all
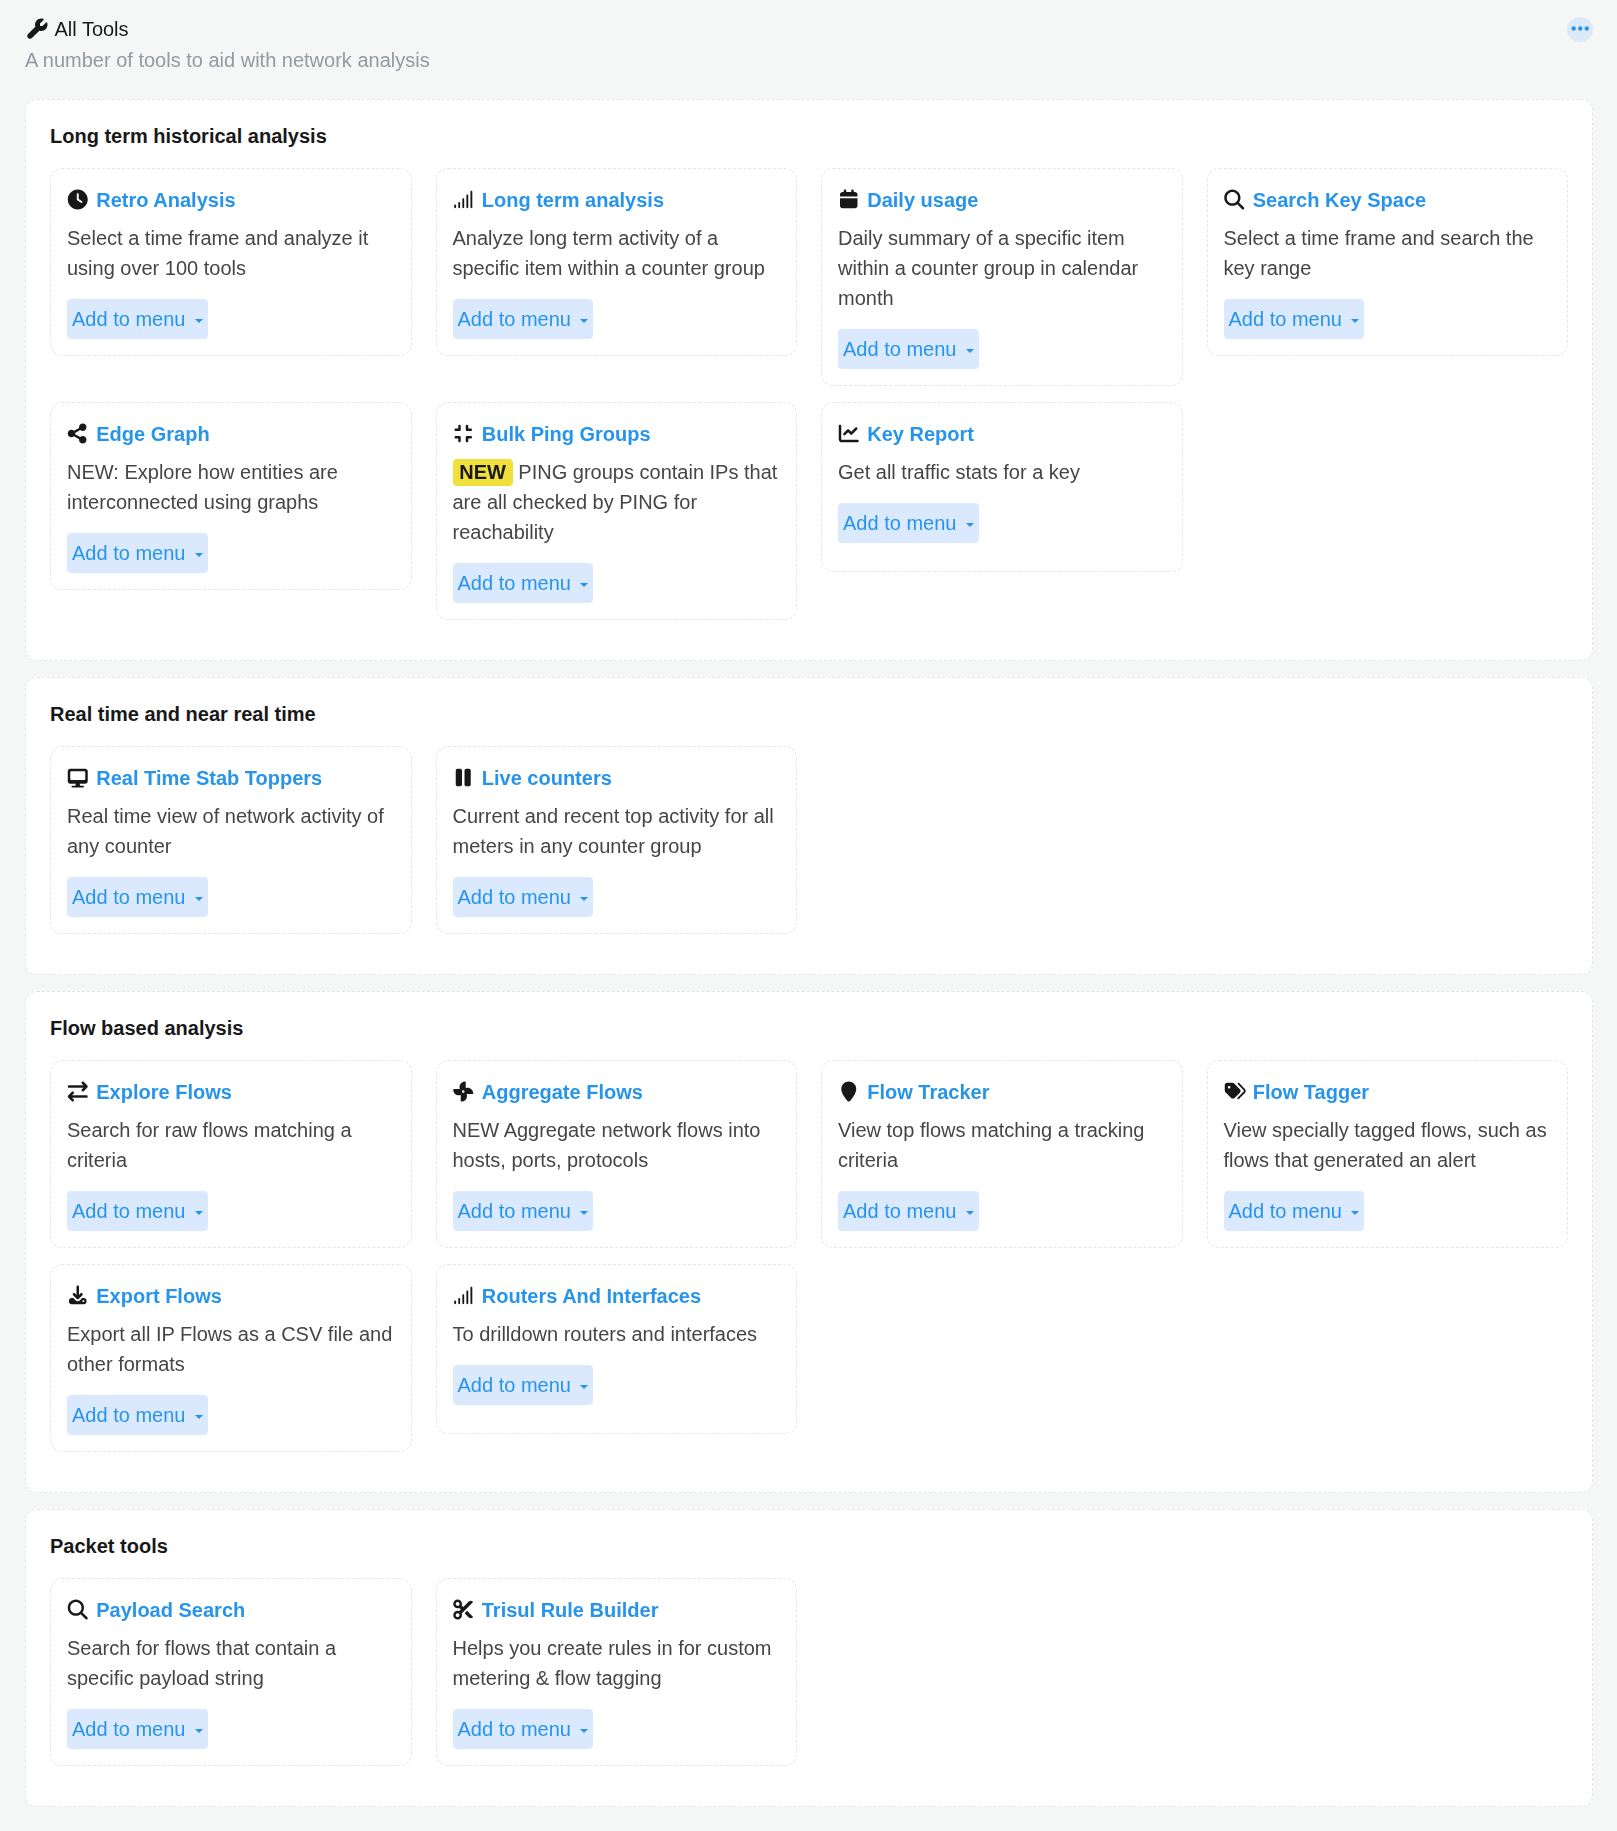
Figure: NetFlow Show all
This page is the central All Tools launcher, where you can find every analysis tool available in the platform, grouped by workflow type. You can also use Add to menu to pin any tool to your custom navigation.
Long Term Historical Analysis
Tools for investigating traffic that already happened — retrospective ("retro") analysis, long-term trends, and calendar-style usage reporting. Trisul stores data unsummarized, so these tools can drill into raw traffic, flows, and alerts from any point in the past.
- Retro Analysis- Performing Retro Analysis, Retro Analysis Tools, and Network FAQ
- Long Term Analysis- Using the Analyze Item Page
- Daily Usage - Using Monthly Charts
- Search Key Space - Using Search Key Space
- Edge Graph - Using Edge Analysis
- Key Report - Using Key Dashboard
Realtime and Near Realtime
Live views of what is happening on the network right now, with roughly a 5-second delay.
Flows Based Analysis
Tools that work directly with individual network flows (as opposed to aggregated counter metrics).
Packet Tools
- Trisul Rule Builder: build rules in Trisul filter format for custom metering and flow tagging.
Live Counters
Live Counters shows you live and recent activity for any counter group, all on one screen without setting any time range or search criteria.
How to Use
To access Live Counters,
👉 Go to Tools → Live Counters
The following Select a counter group form opens up.
| Field | Description |
|---|---|
| Counter Group | Select any counter group you want to monitor (Apps, Hosts, ASNumber, City, Blacklist, and so on; any counter group available in your deployment) |
Once you select a counter group, the result screen updates immediately without using any Submit button.
The result screen shows live toppers of the counter group you selected. The items, meters, and values shown depend entirely on the counter group chosen. For example, selecting Apps shows top applications, selecting ASNumber shows top autonomous systems, and so on.