All Alerts
Summary of All Alerts is the single consolidated listing of every alert Trisul has raised across threshold crossing, flow tracker, IDS/Suricata, malware and blacklist, DDoS, and every other alert class in one place. Use it when you need the complete picture instead of checking each alert type separately.
What Can You Do With All Alerts?
- See every alert Trisul has raised in one place, regardless of which detection engine or alert class generated it.
- Group results by Source IP, Destination IP, Signature, or Description to spot patterns — a handful of IPs responsible for most of the noise, or one signature firing far more than the rest.
- Drill into an individual alert for more context, or download the underlying packet capture for offline analysis.
- Export the current result set for reporting or further investigation outside Trisul.
Viewing the Alert Listing
👉 Go to Security → All Alerts
The page itself is titled External IDS Listing once you're on it. That's expected, it's the same view, just labeled from the detection-engine side rather than the menu side.
The top of the page shows the active time window, for example, 18 Hrs:26 Mins Starting 2026-09-21 00:00:00 +0530 so you always know exactly how far back the listing reaches before reading the results.
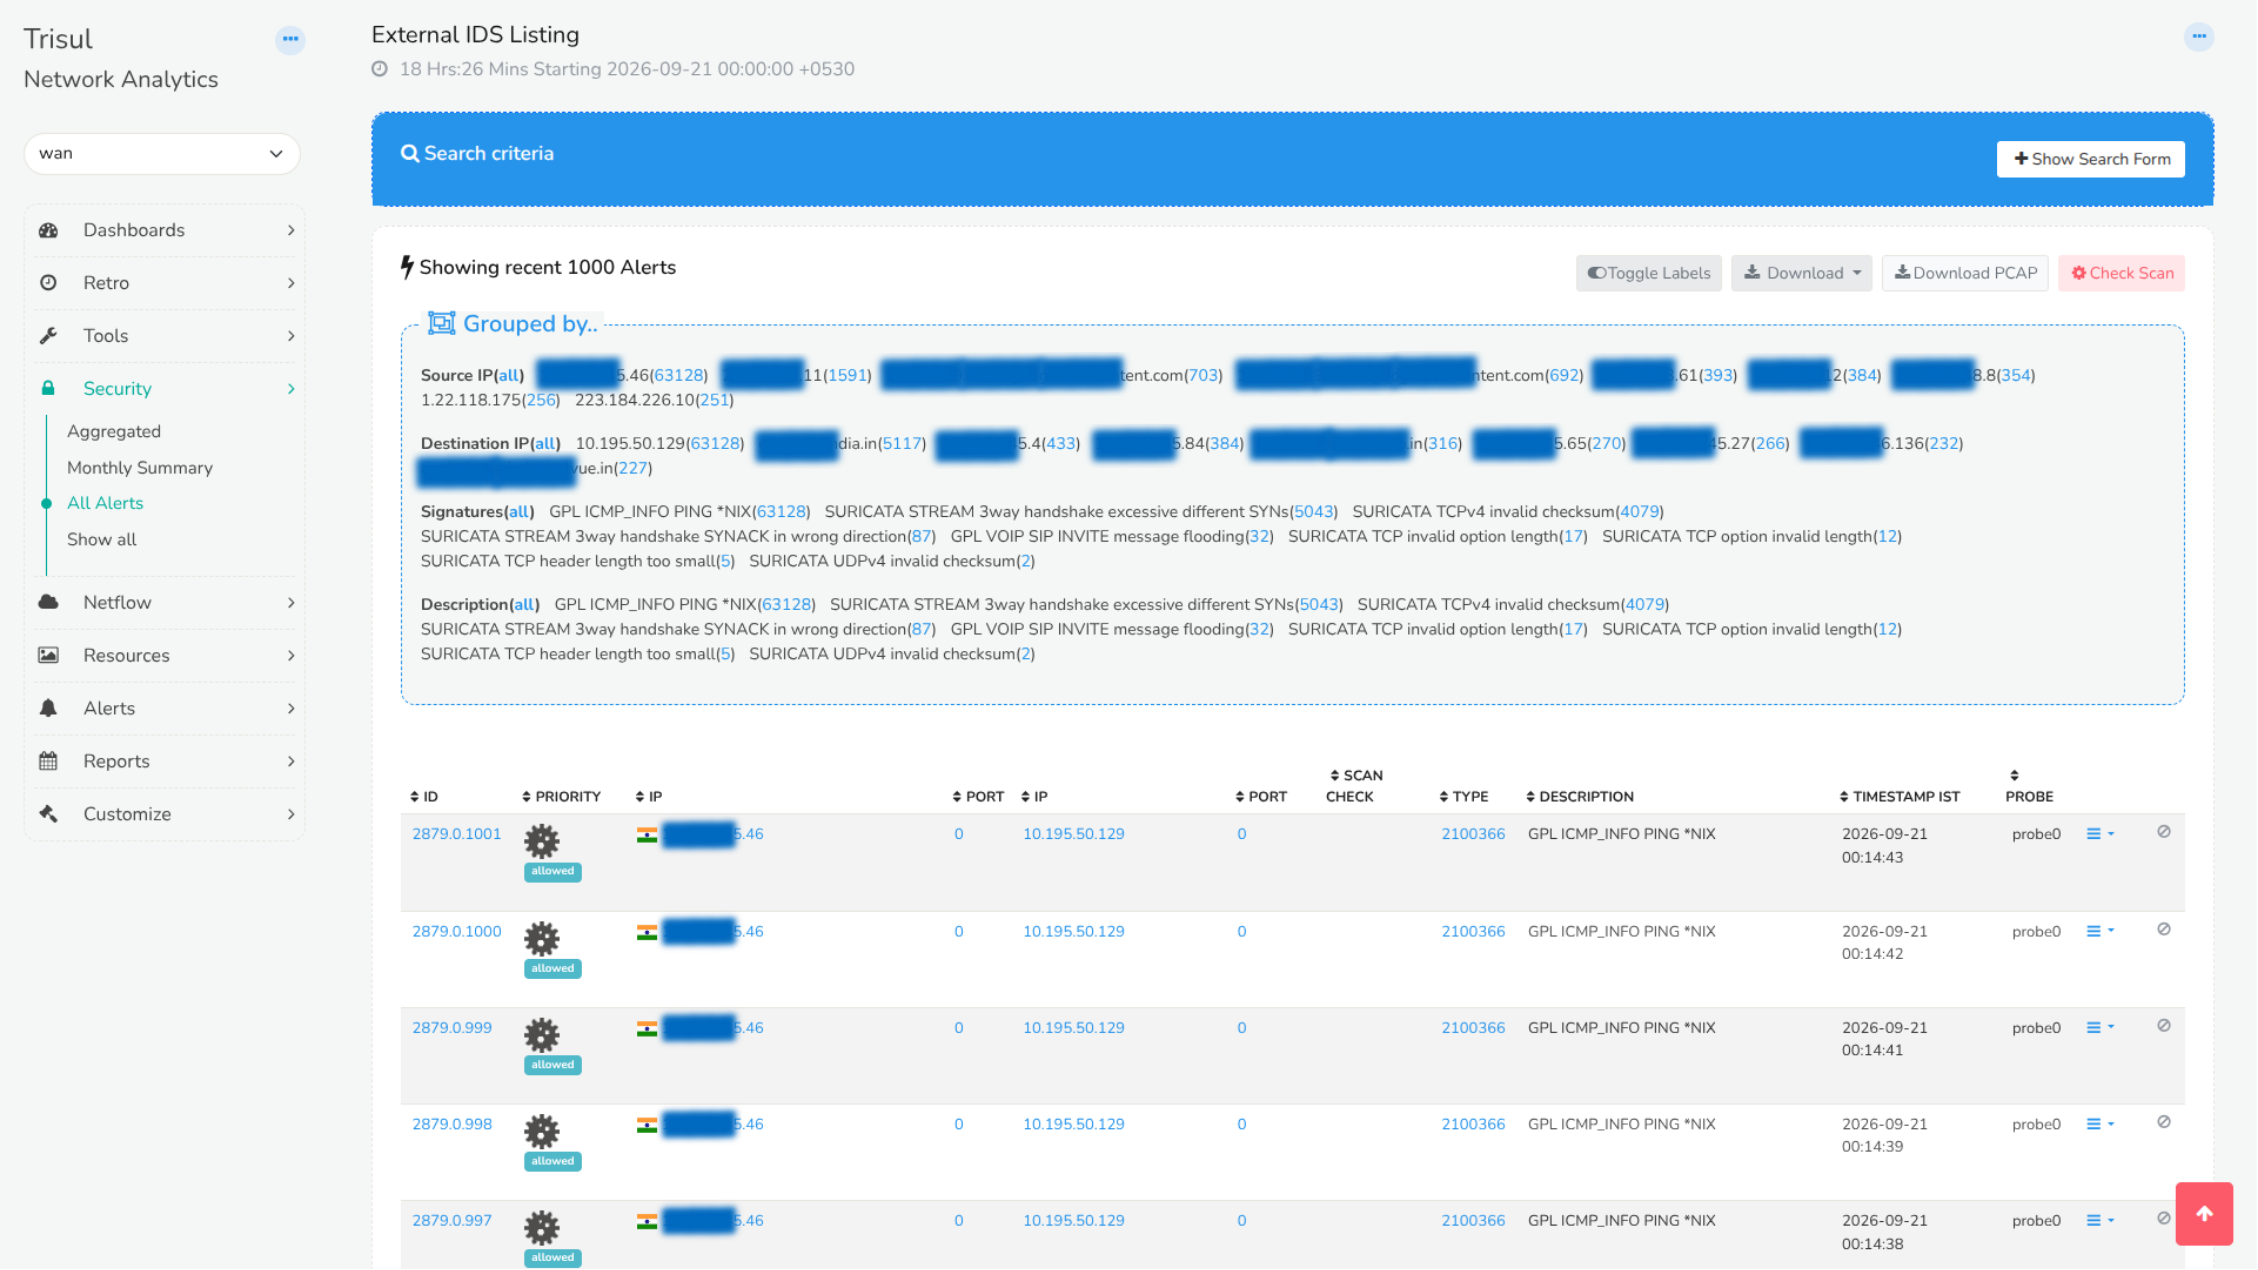
Figure: All Alerts / External IDS Listing
Show Search Form
Click + Show Search Form to open the search criteria panel and narrow the listing down — by IP, signature, time range, or other available fields — before Trisul returns results.
Grouped By Options
Directly below the search bar, Trisul automatically groups the current result set:
| Group | Shows |
|---|---|
| Source IP | The IPs generating the most alerts, with a count next to each |
| Destination IP | The IPs being targeted most often, with a count next to each |
| Signatures | The Suricata/IDS signature names that fired, with a count next to each |
| Description | The human-readable description tied to each signature, with a count next to each |
Grouped By is usually the fastest way to triage a busy alert window — a handful of source IPs or signatures dominating the counts is often the real story, not the individual alerts underneath them.
Showing Recent 1000 Alerts
Below the Grouped By panel, individual alerts are listed in a table:
| Column | Description |
|---|---|
| ID | Trisul's internal alert identifier |
| Priority | The alert's priority, shown with an action tag (for example, allowed) |
| IP / Port | Source IP and port |
| IP / Port | Destination IP and port |
| Scan Check | Result of an associated scan check, where applicable |
| Type | The numeric signature ID that fired |
| Description | The human-readable signature description |
| Timestamp IST | When the alert fired |
| Probe | Which probe captured the traffic that triggered the alert |
Working With Results
Across the top of the table:
- Toggle Labels — switch between raw values and resolved/labeled names where available.
- Download — export the current result set.
- Download PCAP — pull the packet capture behind the listed alerts for offline analysis.
- Check Scan — re-runs the scan check against the currently listed alerts.
Drilldown Options
Each row has its own action menu (⋮ ▾) for drilling into that specific alert, plus a quick-action icon for suppressing it from future listings.
Downloading PCAP for a large result set can produce a very large file — narrow the search criteria first if you only need packets for a specific IP, signature, or time range.
For the Alert Bar and the other ways to view a summary of all alerts, see Summary of All Alerts in the User Guide.