Working with Edges
The entry point into exploring the streaming graph database of Trisul is to select two items
- A root vertex from where you can enter the graph.
- A time window
All exploration is done in a tool called the “Edge Graph Explorer”.
Enable Feature
New installations of Trisul will already have Edges enabled. If you are upgrading an older install, ensure that you add the following line in trisulProbeConfig.xml
<Edges> <Enable>True</Enable> </Edges>
View Edge Graph
- To generate an Edge Graph, navigate to the Key Dashboard by selecting a key from the dashboard. Within the Key Dashboard, locate the Key Details section. From there, initiate the Edge Graph display by clicking on the "Drilldown" button and selecting "View Edge Graph". This is one covenient way to view an edge graph from anywhere like dashboards with keys.
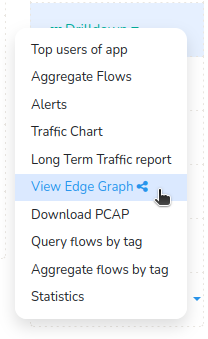
Figure: View Edge Graph Menu Option
- But you can access Edge Graph directly using specific criteria, for that,
👉 Go to Tools→Edge Graph
This will open up the search criteria form for the edge graph with hide/show search form option.
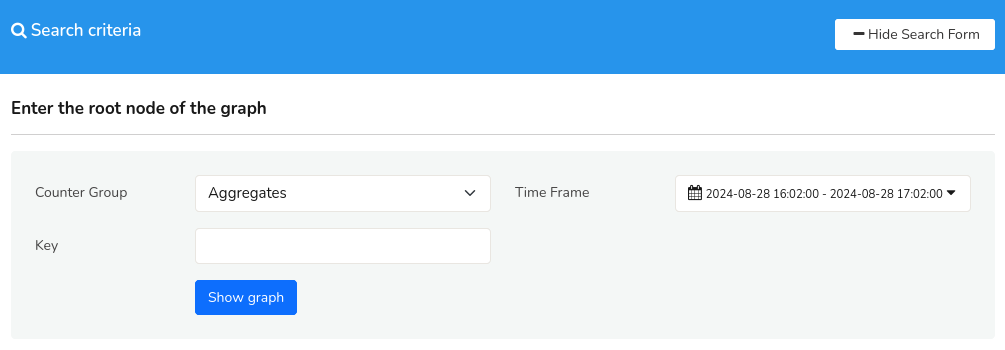 Figure: Search Criteria for Edge Graph
Fill in the Edge Graph form with the help of the following fields and descriptions to define a search criteria.
| Field | Description |
|---|---|
| Counter Group | Select a counter group from the list |
| Time Frame | Select a time range from the Time Selector |
| Key | Enter a key within the counter group to set as the "root vertex" |
Click Show Graph to view the edge graph for the search criteria defined by you.
Edge Graph Overview
Graph Explorer
The Graph Explorer is an intuitive, point-and-click interface designed for navigating and examining the graph network.
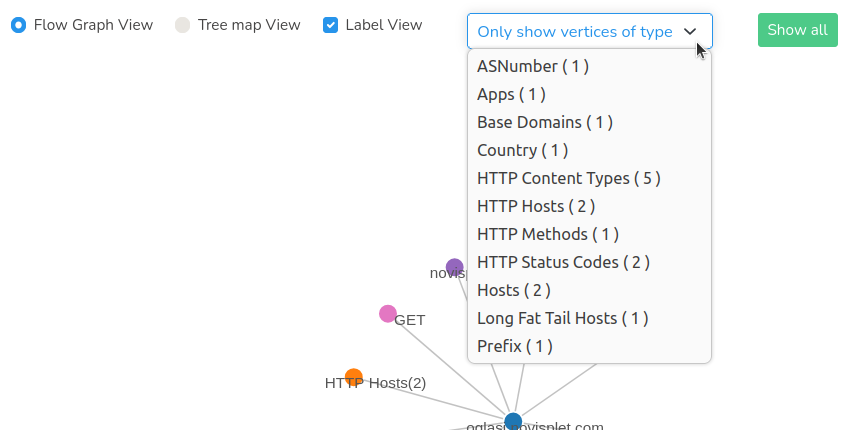
Figure: Edge Graph Explorer
The Edge Graph explorer options include:
| Options | Description |
|---|---|
| Flow graph view | Displays the graph network in a flow-based layout, illustrating the relationships between nodes and edges. |
| Treemap view | Renders the graph network as a treemap, using nested rectangles to represent the hierarchical structure of the nodes and edges. This is a cleaner option in some cases |
| Label View | Toggles the display of labels for nodes and edges, providing additional context and information about the graph entities. |
| Only Show Vertices of Type | Filters the graph network to display only nodes of a selected type, allowing for focused analysis on specific entities or groups. |
| Show All | Resets the graph network to its default view, displaying all nodes and edges without any filters or restrictions. |
To declutter a messy force graph, select a highly connected node, drag it to an empty area, and gently "shake" it to settle the graph into a better layout.
Upon initial generation, the Graph Explorer presents the following features:
Initial View
- Displays immediate adjacent nodes for easy reference
- Vertices are grouped and color-coded for visual distinction
Tree Map View
The Tree Map View represents the graph network as a branching layout, illustrating the organization of nodes.
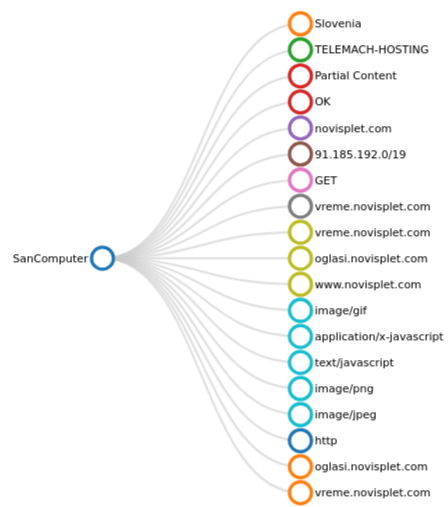
Figure: Edge Graph- Tree Map View
This visualization:
- Shows a clear and organized structure, with relative nodes branching out from a central root
- Highlights the relationships between nodes and their connection to the root vertex
Suitable for a clean and intuitive visualization of the graph network
Interactive Features
- Hover: Mouse over a node to reveal additional drilldown options.
- Click: Select a node to expand and display its 1-level adjacent neighbors, enabling further exploration of the graph network. By clicking on a key you can further drilldown to two options:
- Go to the key dashboard of the selected key.
- Set as root node option allows you to generate a new edge graph with the selected key as root node.
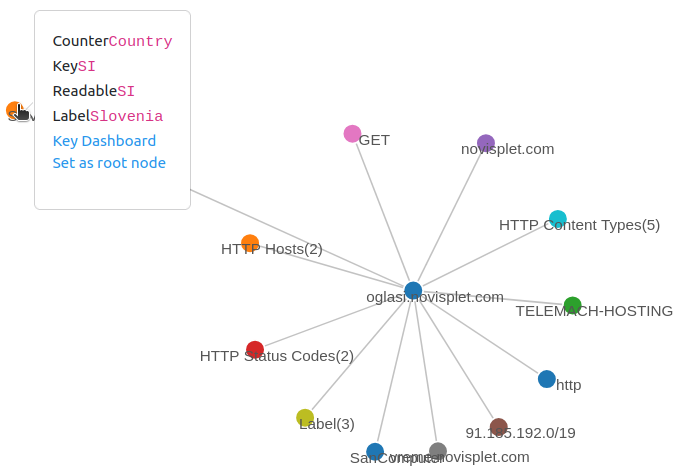
Figure: Initial View and Interactive Features of Edge Graph