Sankey Drilldown
The Sankey Drill Down App, can be downloaded from TRISUL Apps. This visualization tool illustrates the split of traffic for various applications, originating from specific routers and interfaces by providing a graphical representation of traffic distribution.
The specialized chart depicts the proportion of traffic allocated to different applications enable users to drill down into specific data points, facilitating in-depth analysis of traffic patterns.
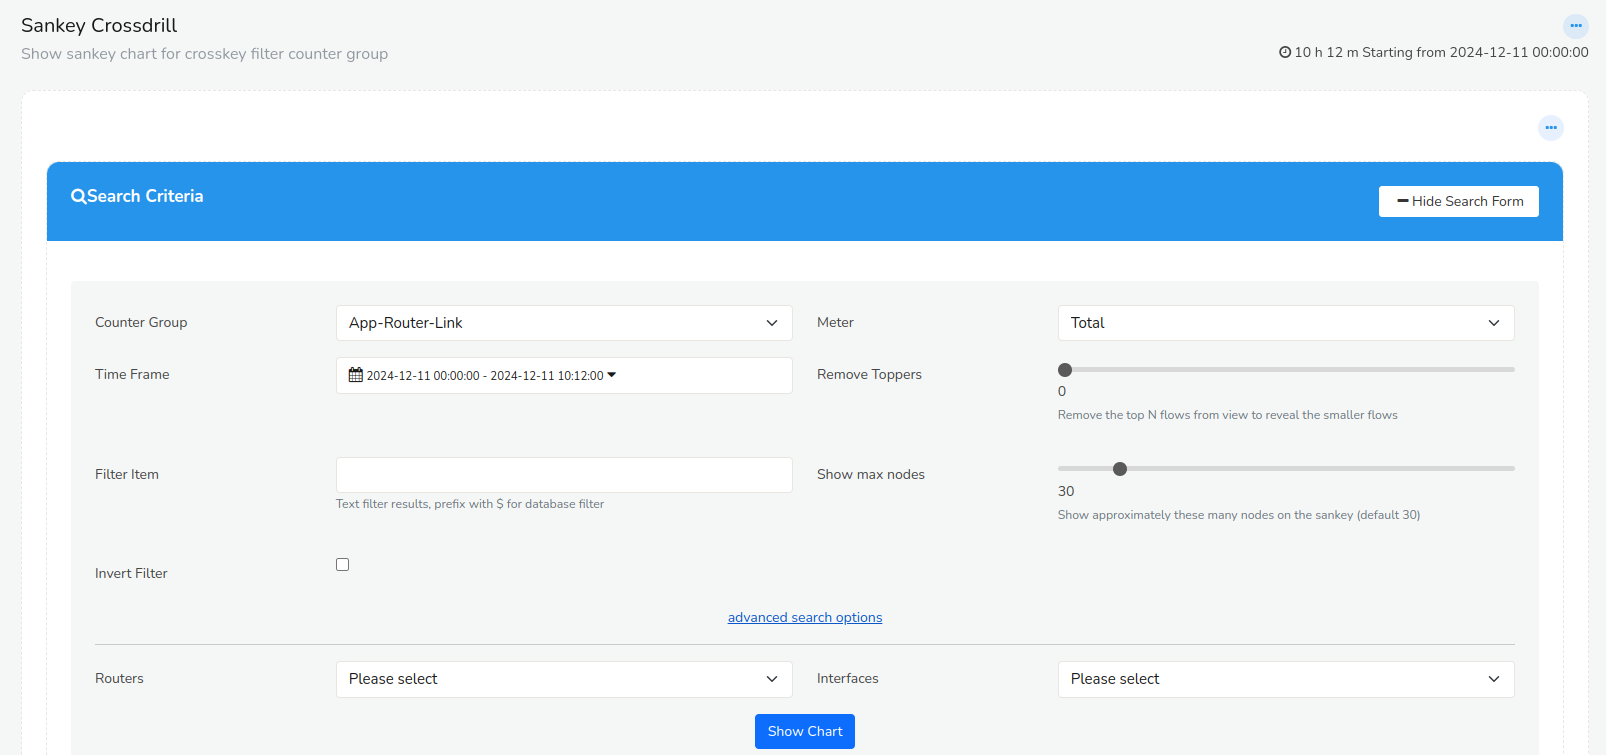
Once downloaded the Sankey shall be available on the Show All dashbaords. Fill in the fields to configure the sankey settings.

Figure: Sankey Crossdrill Search Criteria Form
| Field | Description |
|---|---|
| Counter Group | Select the counter group to analyze. Counter groups categorize traffic based on specific criteria. |
| Time Frame | Choose the time frame for which you want to analyze traffic patterns. |
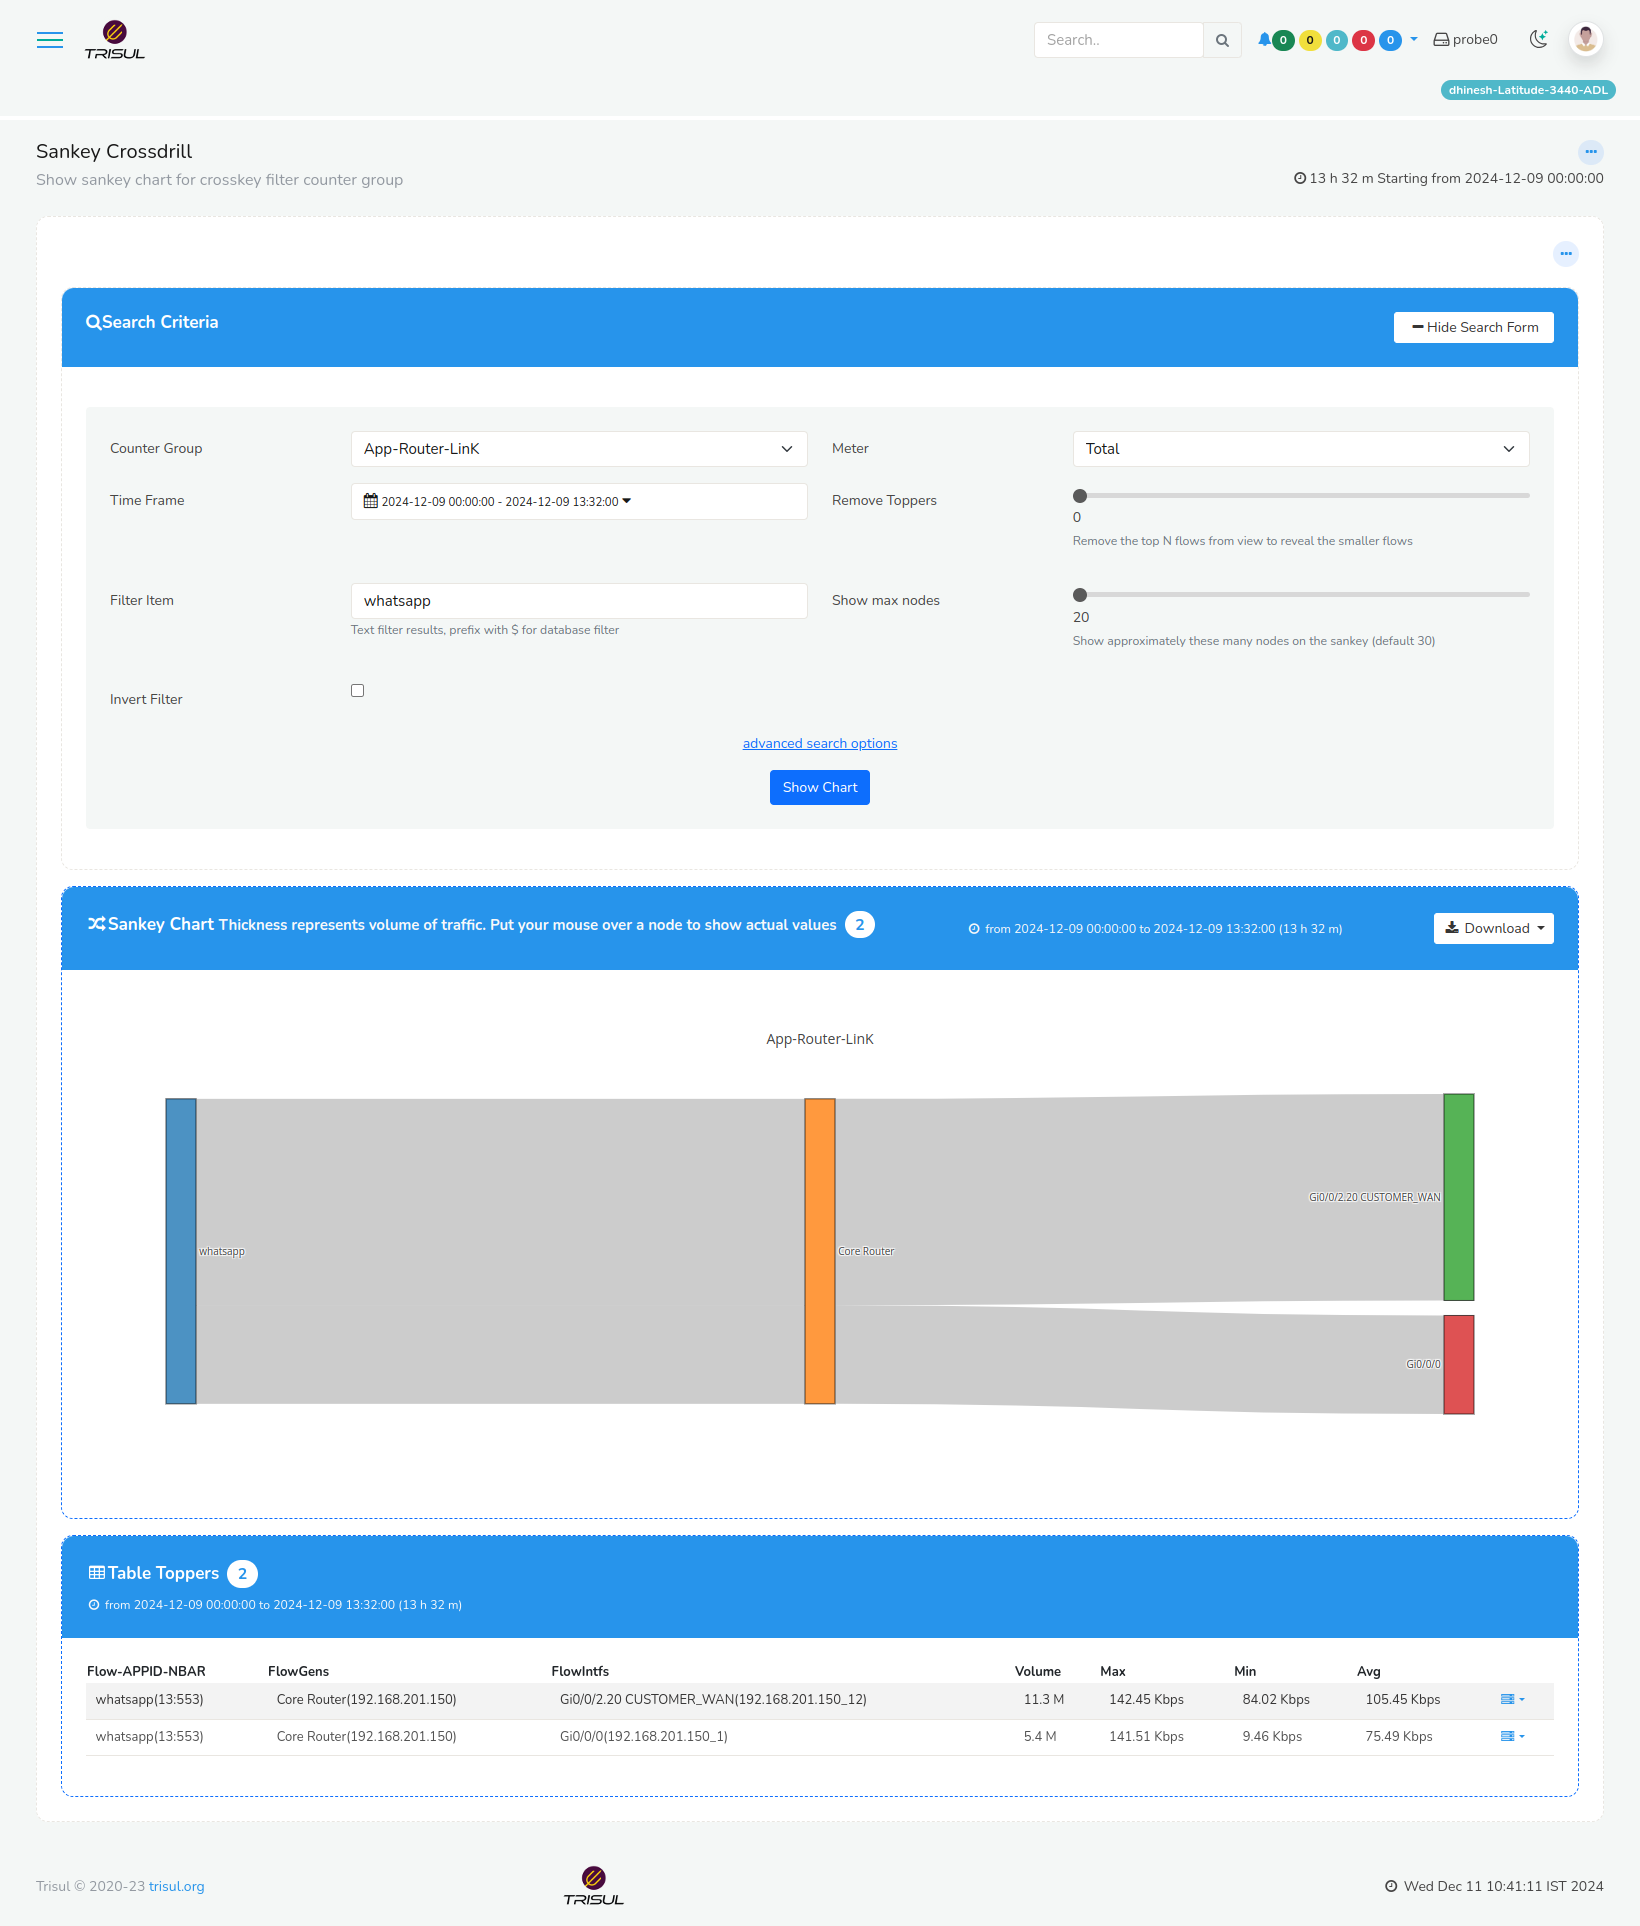
| Filter Item | Apply filters to narrow down the analysis based on specific items, such as application names |
| Meter | Select the metering option to measure traffic |
| Remove Toppers | Move the slider to left or right to exclude top traffic contributors from the analysis, allowing for a more detailed view of lesser contributors. |
| Show Max nodes | Move the slider to left or right to specify the maximum number of nodes to display in the Sankey diagram. |
Advanced Search Options
| Field | Description |
|---|---|
| Routers | Select specific routers to include in the analysis. This helps in understanding traffic patterns across different network segments. |
| Interfaces | Choose the interfaces to analyze. This could be specific ports, VLANs, or other interface types. |
The Sankey Cross Drilldown Chart : Component Breakdown
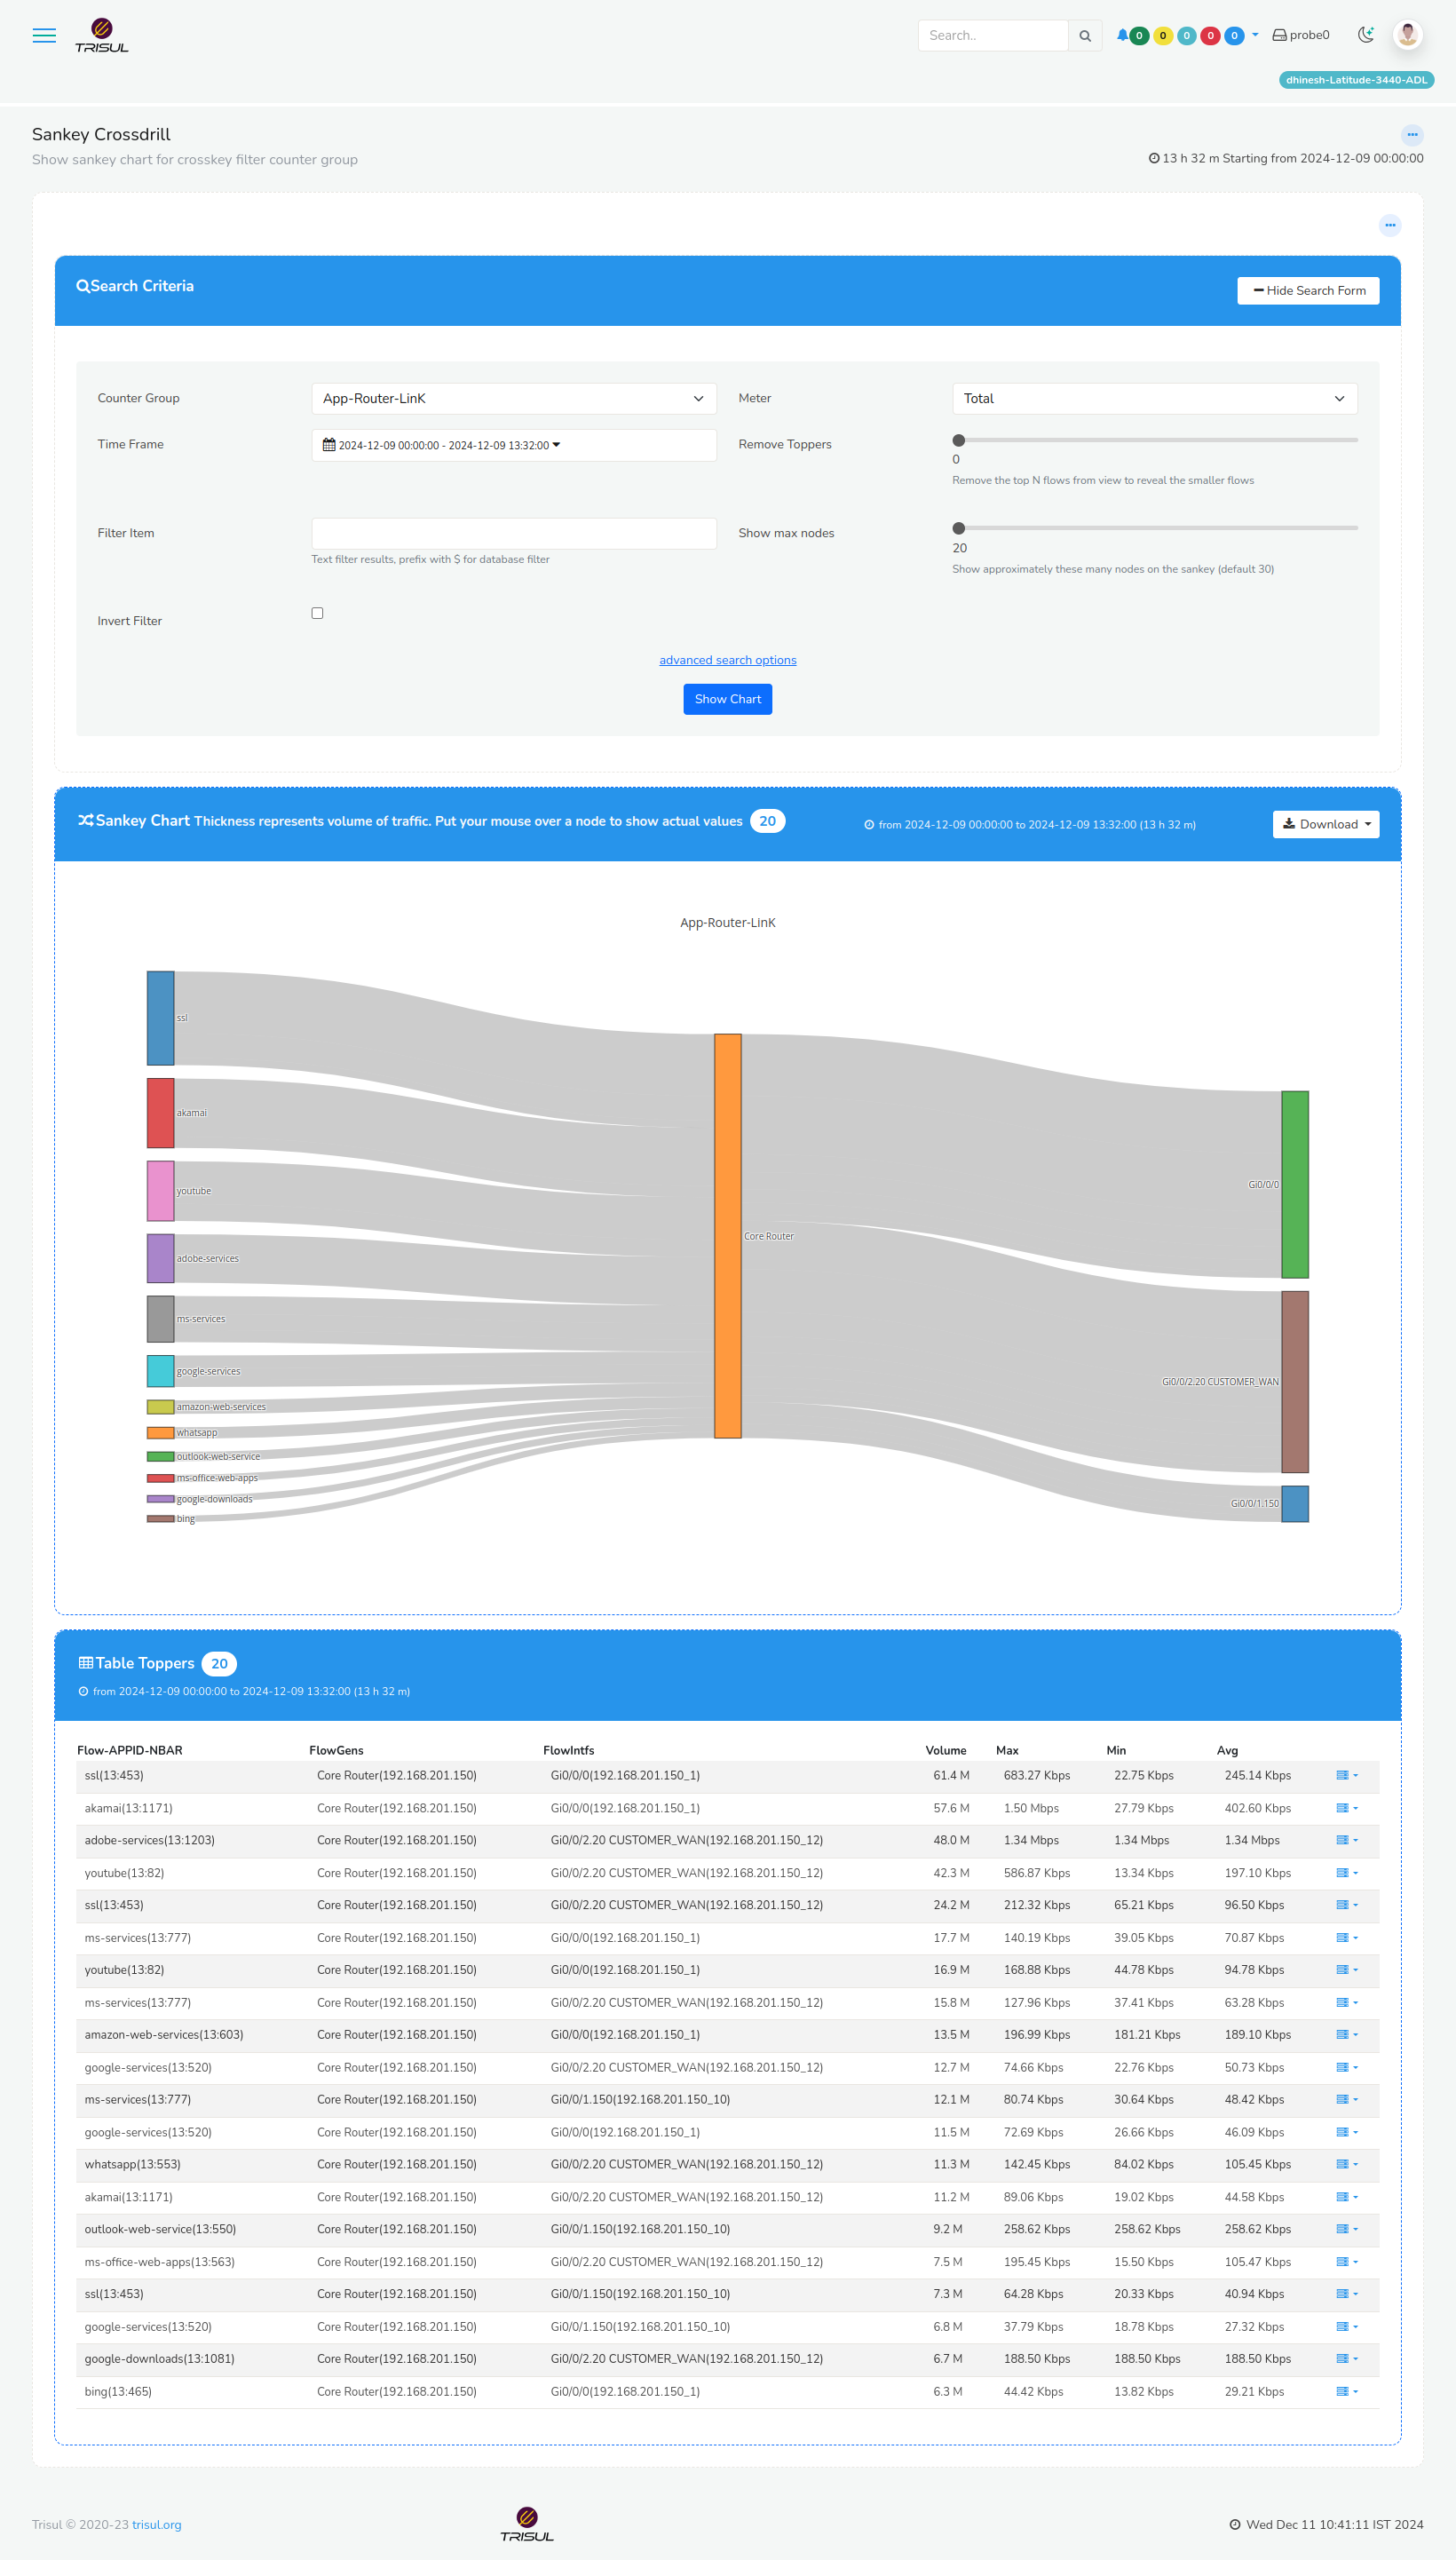
The Sankey Cross Drilldown Chart is a visualization tool that represents the traffic flow across different network components. The chart is divided into three main sections:
Left Section: Applications/App Labels
- Displays a list of applications or app labels that are generating traffic
- Each app label represents a specific source of traffic
Center Section: Router
Represents the router through which the traffic passes Serves as the central hub, connecting applications to interfaces or links
Right Section: Interfaces/Links
Displays a list of interfaces or links through which the traffic passes Each interface or link represents a specific path that traffic takes as it exits the router

Figure: Sankey Crossdrill without Filter
The Sankey Cross Drilldown Chart in a tabular format provides a more detailed and comprehensive view of the traffic flow across different network components. The table includes the following columns:
| Option | Description |
|---|---|
| Flow-APP ID- NBAR | Displays the application ID and name, as identified by Network-Based Application Recognition (NBAR). This column provides insight into the specific applications generating traffic. |
| FlowGens | Represents the flow generators, which are the sources of traffic. This column helps identify the origins of traffic flows. |
| FlowIntfs | Displays the flow interfaces, which are the paths through which traffic flows. This column provides information on the network interfaces involved in traffic transmission. |
| Volume | Shows the total volume of traffic, measured in bytes. This column provides a quantitative view of traffic flow. |
| Max | Displays the maximum traffic value recorded during the analysis period. This column helps identify peak traffic levels. |
| Min | Shows the minimum traffic value recorded during the analysis period. This column helps identify low traffic levels. |
| Avg | Displays the average traffic value recorded during the analysis period. This column provides a baseline view of typical traffic levels. |

Figure: Sankey Crossdrill with Filter