Introduction to Dashboards and Modules
What are Dashboards?
A Dashboard is a visual tool that displays key performance indicators (KPIs) and metrics to help you monitor and understand network traffic performance. Dashboards provide real-time visibility into your network, allowing you to track activity as it happens.
In Trisul, a dashboard is made up of multiple modules placed in different positions, each showing specific types of data.
Dashboards are,
- Visual- You can use charts, graphs, tables and other visual elements to display data
- Interactive- You can interact with dashboards to drilldown into details, filter data, and explore different scenarios
- Real-Time- Dashboards display up to date data reflecting the current status of the network
- Customizable- You can play around with dashboards that can be personalized/customized to specific needs of different users
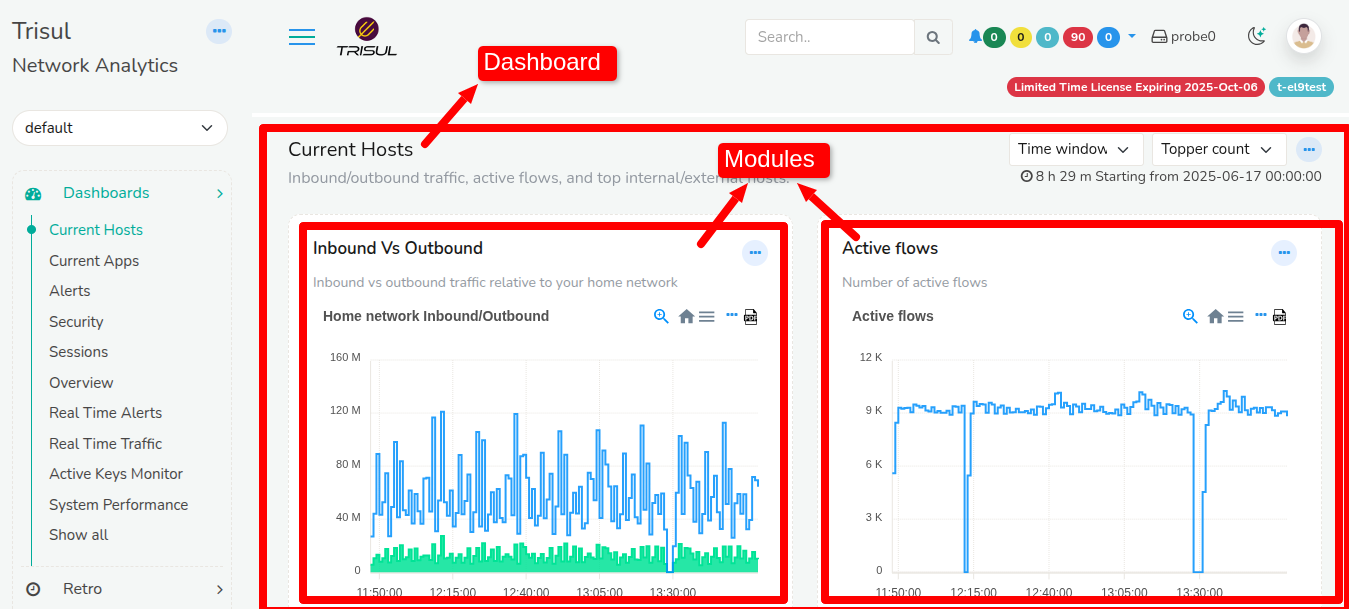
Figure: Showing Dashboard and Modules
What Are Modules?
Modules are the building blocks of a dashboard in Trisul. Think of them like widgets or tiles—each one shows a specific piece of information to help you monitor and understand your network.
Modules display metrics in different formats such as numbers, charts, tables, and more. You can add as many modules as you need to a dashboard, and each one can be customized to focus on a particular type of data or insight.
Modules help you:
- Analyze network traffic
- Understand traffic patterns
- Detect anomalies
- Identify security threats
Types of Modules
Here are the common types of modules you can add to a dashboard:
- Charts and Graphs
Visualize trends and comparisons using line charts, bar graphs, pie charts, etc. - Tables and Lists
Show detailed tabular data like IP addresses, hosts, or flow records. - KPIs (Key Performance Indicators)
Highlight important numbers, percentages, or thresholds. - Maps and Geospatial Views
Display location-based data, such as where traffic is coming from. - Texts and Labels
Add titles, descriptions, or notes to explain sections of your dashboard. - Gauges and Meters
Show live progress or usage indicators (like a speedometer or dial). - Real-Time Traffic Feeds
Stream live traffic updates, alerts, and anomaly indicators. - Custom Modules
Create your own modules or integrate with external tools to show specific data.
Key Rules For Modules and Dashboards
- A dashboard may contain several modules.
- A module may appear in any number of dashboards.
- A module may even appear multiple times in the same dashboard.
- A change in a module property will propagate to all the dashboards which use the module.
- If there are no modules in a particular position that position is not rendered at all as trisul modules auto adjust for width.
An Example - Current Hosts
The first screen you will see when you login as user is the Current Hosts dashboard

Figure: Current Host Dashboard
You can see that this dashboard is nothing but four modules laid out in two columns. Trisul has well defined column positions into which you can place modules. See Module Positions in "Add Modules to a New/Existing Dashboard"
Lets take a closer look at the dashboard shown above.
| Top 2 position column 1 | Top 2 position column 2 |
|---|---|
| Module : In vs out traffic (past 6 hours) | Module : Active TCP connections (past 6 hours) |
| Module : Top Internal Hosts (current) | Module : Top External Hosts (current) |
View a Dashboard/All Dashboards
There are more than one way to navigate to view all dashboards
Method 1:
👉 From the Menu, Go to Dashboards → Show all
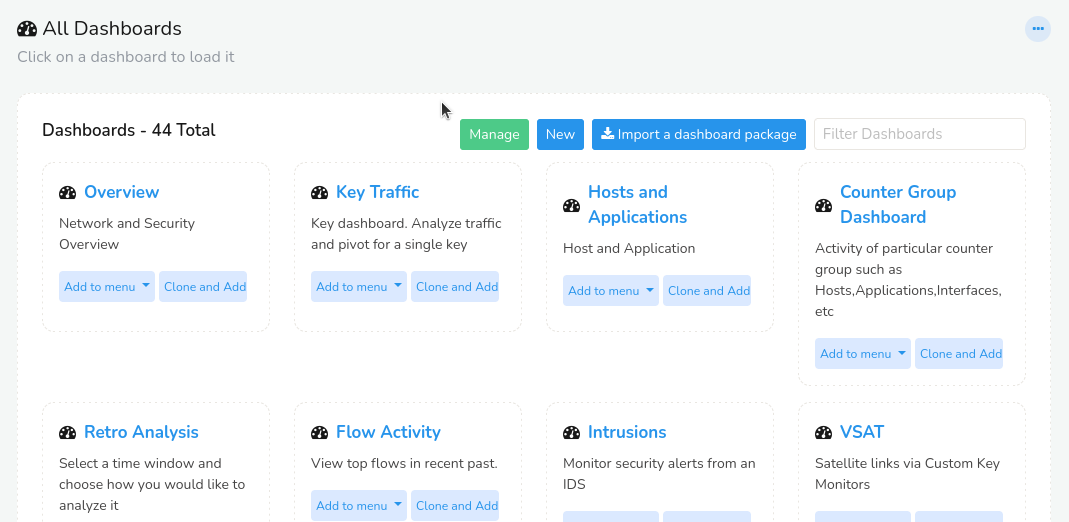
Figure: Showing All Dashboards
This shows the list of available dashboards.
Method 2:
👉 From the Menu, Go to Customize→ Show all→ Dashboards
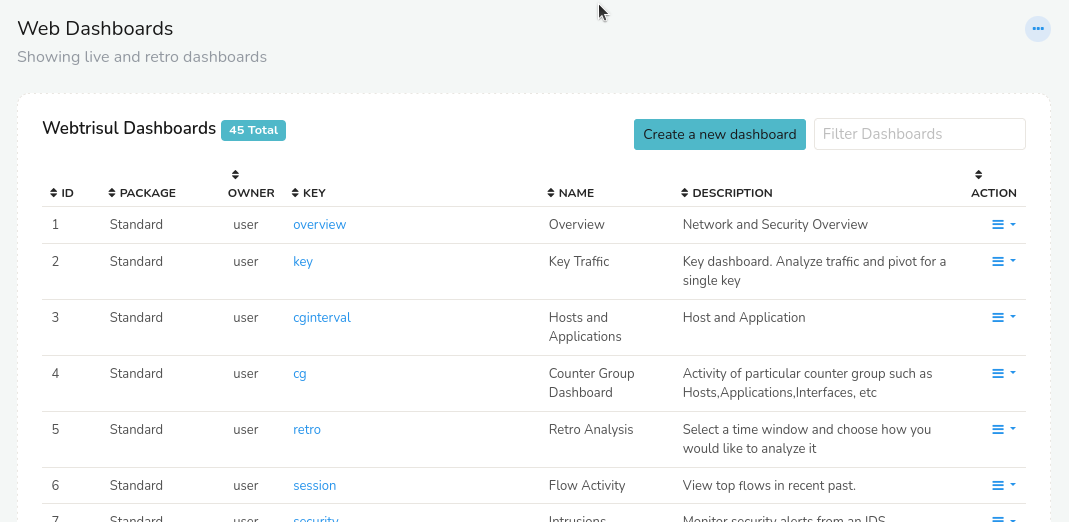
Figure: Showing All Dashboards
This also shows the list of available dashboards.
To open a particular dashboard, from the list of dashboards, click on the dashboard you would like to view.
View a Module/All Modules
To view all modules,
👉 From the Menu, Go to Customize→ Show all→ Modules
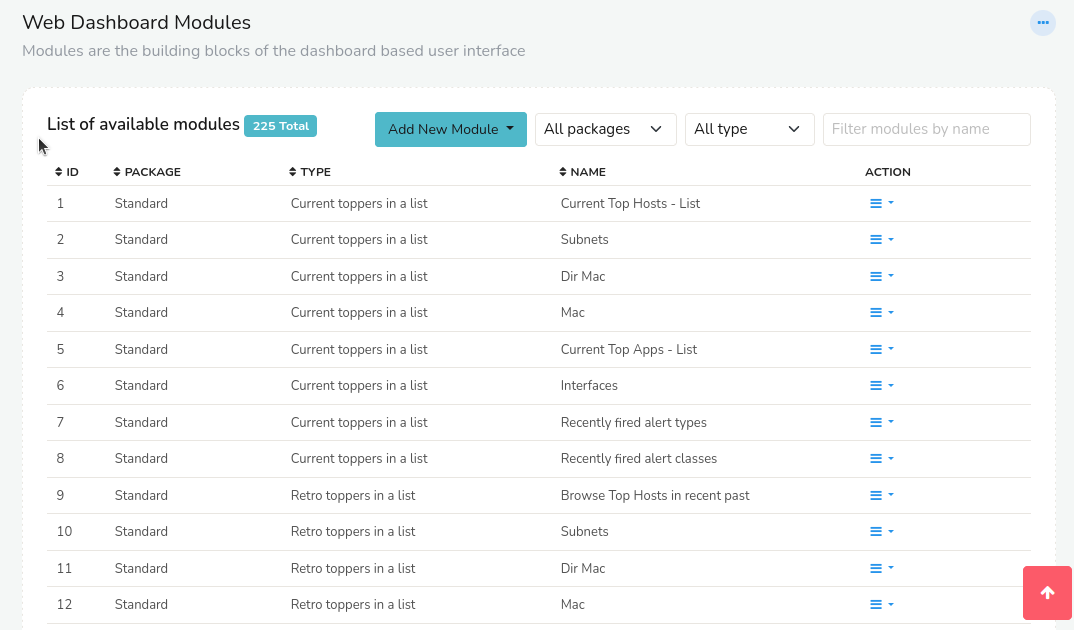
Figure: Showing All Modules
This will show a list of all available modules.
To view one particular module from the list, check on the name of the dashboard that contains the module and navigate to that dashboard to select the module.
Dashboard Customization
Dashboard Menu Button
You can manage the layout and contents of a dashboard using the menu options available at the dashboard level. To access these options, click the ellipsis icon located at the top-right corner of the dashboard window.
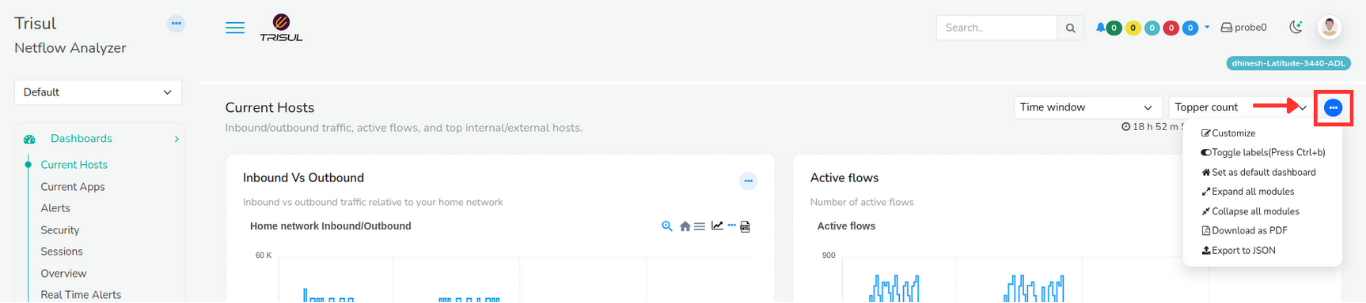
Figure: Dashboard level menu options
Dashboard Menu Options
The following operations can be performed using the dashboard menu options:
| Operation | Description |
|---|---|
| Customize | Personalize the dashboard by rearranging modules, changing the layout, or editing dashboard parameters such as name and description. |
| Toggle labels | Show or hide the title and descriptive labels of each module. Hiding labels gives a cleaner look, while showing them provides more context and detail. |
| Set as default dashboard | Save the current dashboard as your default home page. It will automatically load when you log in next time. |
| Expand all modules | Expand all collapsed modules on the dashboard to display full details at once. |
| Collapse all modules | Collapse all expanded modules to create a compact, less cluttered view. |
| Download as PDF | Export the current dashboard view as a PDF file for reporting or sharing. |
| Export to JSON | Export the dashboard configuration and data in JSON format, useful for backups or importing elsewhere. |