Custom Reports
Custom Reports in Trisul are customizable reports created by users that can provide tailored views of network activity to suit their requirements. These are flexible reports where users can also gain insights into network activity that can extend to other reports that may not be covered by the pre-defined Readymade Reports. Users can incorporate custom data and filters to help you focus on specific network activity i.e. any metric for any counter group with a particular key.
Custom Reports are based on three main parameters like Traffic,Toppers & Volume. Custom Reports work with Report JSON, where a common format is followed. You can refer to that and create your own reports.
Custom Reports Page
The Custom Reports Page comes with four main components,
- Create New Report Button
- Filter
- Time Selector
- Custom Report List
Create New Report Button
Using Create New Report button you can create a new custom report in two ways.
- You can import a report by clicking on the small arrow on the right side of the Create New Report button which will drop down with an option Import from JSON. Click on that and choose a file to import and click Import.
- Click on the Create New Report button itself and a dialog box apperas with the following fields.

Figure: Custom report Index view
You will get a dialog box with fields.
| Field Name | Description |
|---|---|
| Report Name | Name for your references |
| Report Header Title | Report title for every page |
This will create an empty report with only Report Name and Report Title.
Filter
Using Filter bar in custom report page you can fetch any particular report searching by the name of the report, title, key, countergroup, label or meter. And it will display the report in that name or all the reports containing the mentioned counter group, meter, key or label.
Time Selector
Select a time frame from the Time Selector to narrow down the data to a relevant interval.
Custom Report List
The custom report list is the list of report names that has been created or imported by you.
The custom report list contains the following columns.
| Column | Description |
|---|---|
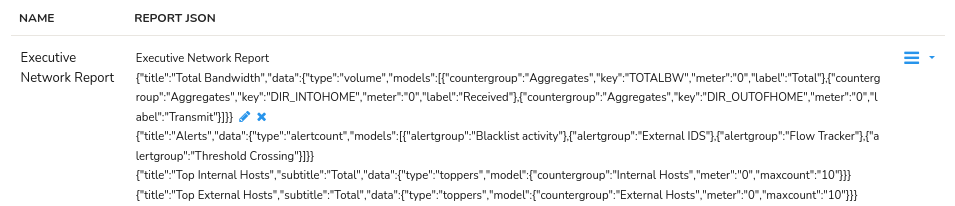
| Name | Name of the Report |
| Report JSON | Contains the report fields in editable JSON format where each report can be edited by clicking the pencil icon next to the JSON report or can be deleted by clicking the x icon next to it |
| Option button | Click on the option button to drilldown for more options to customize the report |
Accessing the Custom Reports
To access the Custom reports,
👉 Login as user and Select Reports → Readymade → Click on the Custom Reports tab.
Once you have created an empty report using Create New Report you can edit the same using the Option button against each report name. The context menu from the option button allows you to perform various functions on the report.
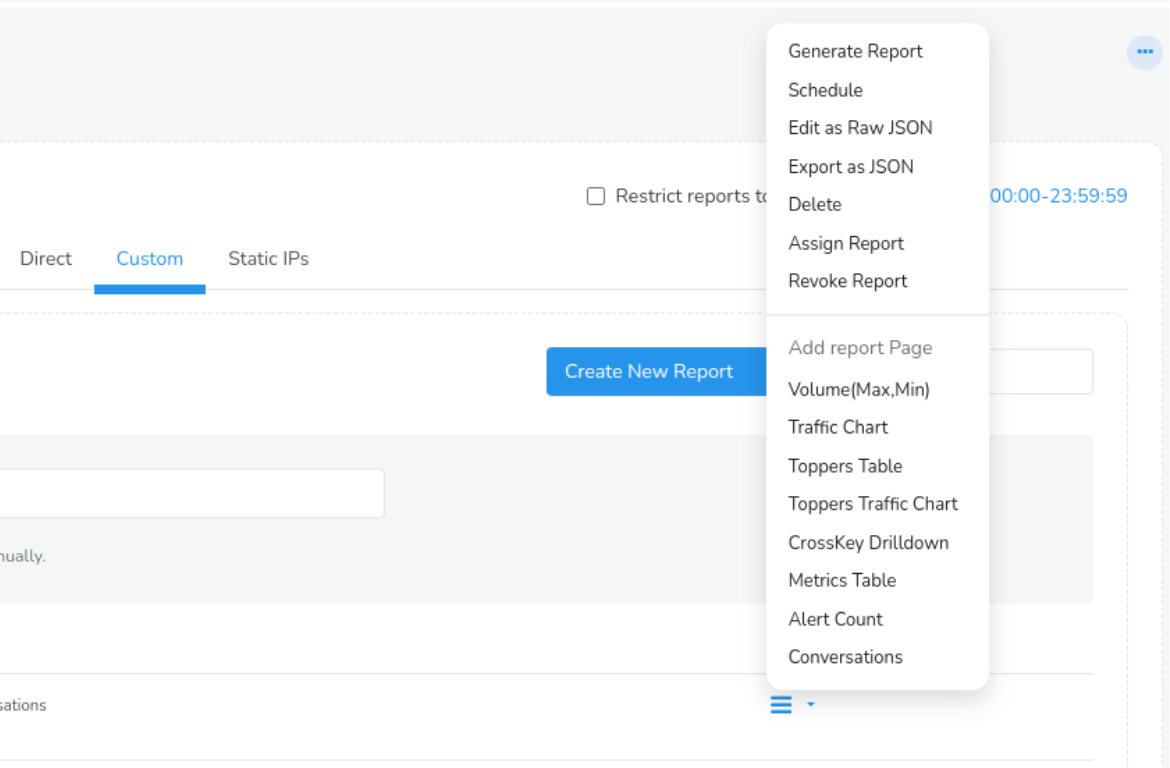
Figure: Available Custom Report types
The following functions can be performed on the selected report name.
| Options | Description |
|---|---|
| Generate Report | Generates the report for the selected Report name for the specified time range from the Time Slector |
| Schedule | Schedule the selected report on hourly,daily,monthly or yearly basis. |
| Edit as Raw JSON | Edit Report as Raw JSON |
| Export as JSON | Export the selected report in JSON format |
| Delete | Delete the selected report |
| Assign Report | Assign the selected report to a particular user from particular context |
| Revoke Report | Revoke the assigned report from the users |
With the option button, there are six different kinds of reports that you can create separately or altogether under one report name.
- Volume Report
- Traffic Chart Report
- Toppers Table Report
- Topper Traffic Chart Report
- CrossKey Drilldown
- Metrics Table Report
- Alert Count Report
- Conversations Report
Volume Report
Volume Report in Trisul is the detailed report on traffic volume of various countergroups that you can choose from. Volume report provides insights into traffic volume, top talkers, traffic classification, and time based analysis. For example if you want to find the volume of http and https, you will use counter group as apps and enter key as http and https.
To create a volume report, Click Volume(Max,Min) Report from the option button against the report name under all the custom reports. You will find the following dialog box to fill in.
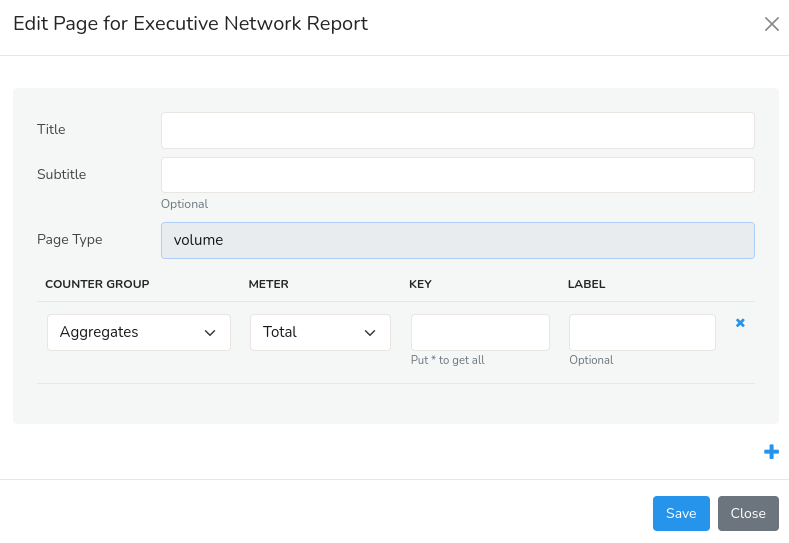
Figure: Search Form for Volume type report
Here is the table with description for available fields to create Volume type reports.
| Field Name | Description |
|---|---|
| Title | Title of the Report |
| Subtitle | Sub-title for the report |
| Page type | Volume |
| Counter group | Select the desired counter group |
| Meter | A parameter or data point within a counter group |
| Key | Enter the valid key-format. Enter * to retrieve 500 items |
| Label | Description of the key item |
If you want to add more keys you can click on the ‘+’ symbol at the bottom of the dialog box.
Select save option.
To view the report, select the option button on the right side against the newly created report. Select generate report option to generate the report you have created
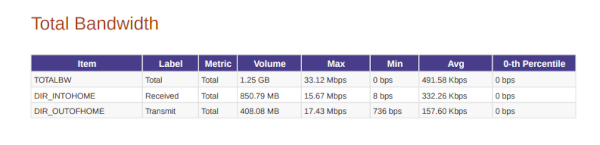
Figure: Sample pdf for Volume based custom report
Traffic Chart Report
A Traffic Chart Report in Trisul is a graphical representation of network traffic volume over a specified time period. It displays the amount of data transmitted (in bytes or packets) across the network, allowing you to visualize traffic patterns, trends, and anomalies. This kind of report is used to provide bandwidth report for several metrics in the form of colorful charts.
To create a traffic chart report, Click Traffic Chart Report from the option button against the report name under all the custom reports. You will find the following dialog box to fill in.
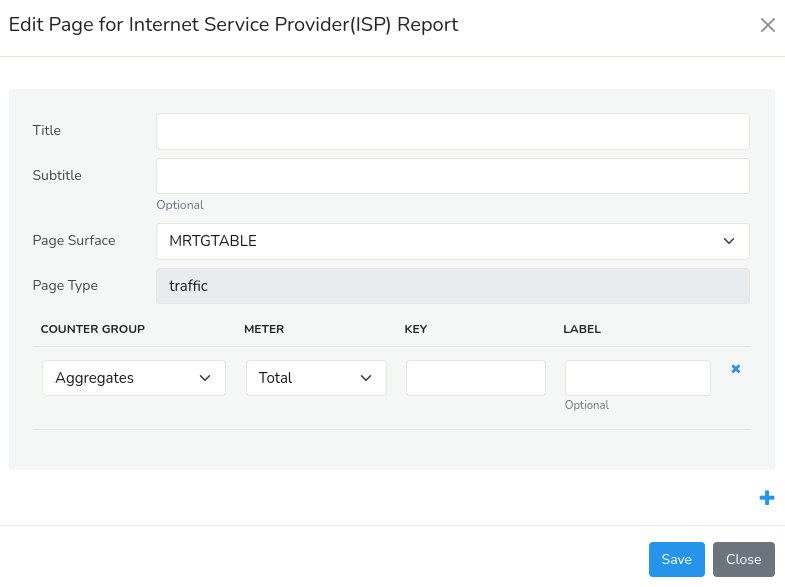
Figure: Search form for traffic type report
Here is the table with description for available fields to create Traffic type reports.
| Field Name | Description |
|---|---|
| Title | Title of the Report |
| Subtitle | Sub-title for the report |
| Page surface | Type of bandwidth chart |
| Page type | traffic |
| Counter group | Select the desired counter group |
| Key | Enter the valid key-format for the metric to be mapped |
| Label | Description of the key item |
If you want to add more keys you can click on the ‘+’ symbol at the bottom of the dialog box.
Select save option.
To view the report, select the option button near the newly created report. Select Generate report option to generate the report you have created
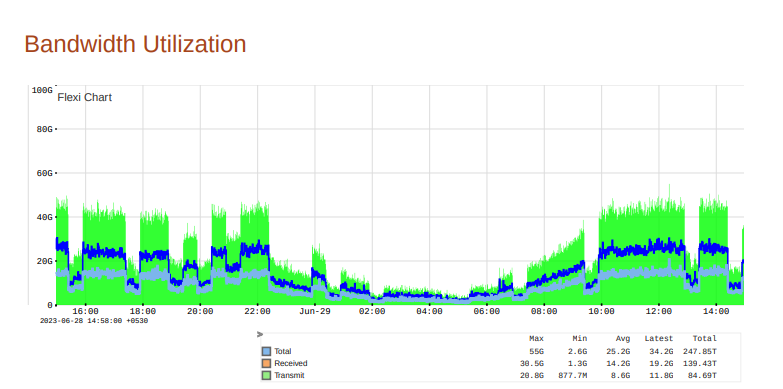
Figure: Sample pdf for Traffic chart based report
Toppers Table Report
This kind of report is generally used to view toppers from several counter groups in the form of a table.
To create a Toppers table report, Click Toppers Table Report from the option button against the newly created report name under all the custom reports. You will find the following dialog box to fill in.
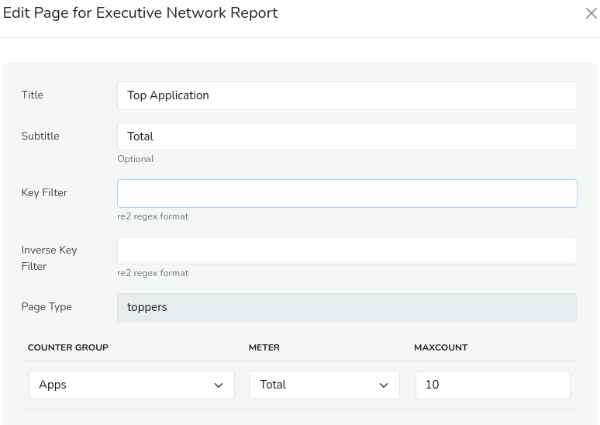
Figure: Search form for toppers type report
Here is the table with description for available fields to create Toppers type reports.
| Field Name | Description |
|---|---|
| Title | Title of the Report |
| Subtitle | Sub-title for the report |
| Key Filter | Filter toppers in re2 regex format |
| Inverse Key Filter | Inverse toppers in re2 regex format |
| Page type | toppers |
| Counter group | Select the desired counter group |
| Meters | Select the meters such as total,transmit,recieved,etc |
| Max Count | Specify the nunber of toppers to be shown |
Select save option.
To view the report, select the option button near the newly created report. Select Generate report option to generate the report you have created
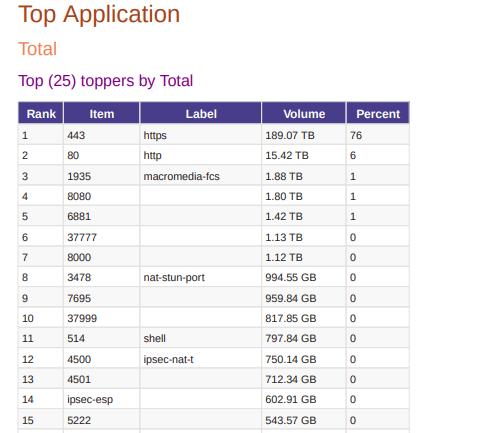
Figure: Sample pdf for Toppers based report
Toppers Traffic Chart Report
A Topper's Traffic Chart Report in Trisul is a report that displays the top traffic generators or consumers on the network, based on criteria such as:
Top Talkers: Devices or hosts generating the most network traffic
Top Listeners: Devices or hosts receiving the most network traffic
Top Protocols: Network protocols (e.g., HTTP, FTP, SSH) generating the most traffic
Top Flows: Network flows (connections) generating the most traffic
To create a Toppers traffic chart report, Click Toppers Traffic Chart Report from the option button against the newly created report name under all the custom reports. You will find the following dialog box to fill in.
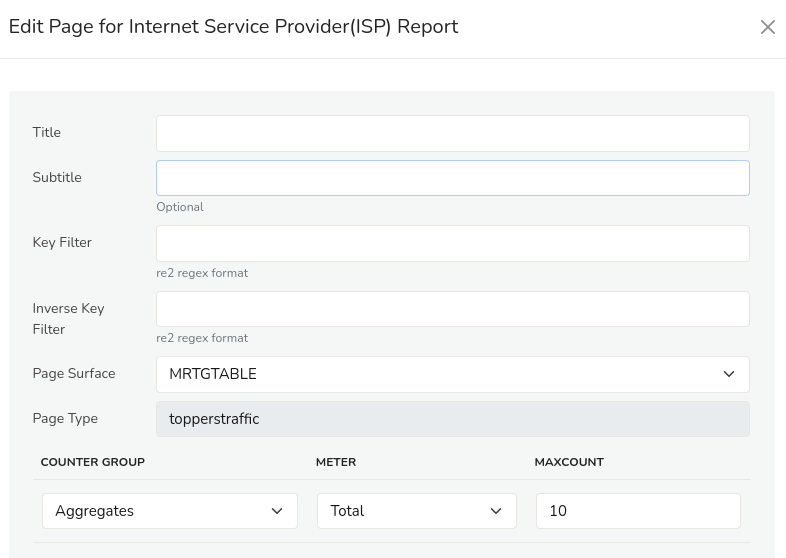
Figure: Search form for toppers traffic chart report
Here is the table with description for available fields to create Toppers traffic chart reports.
| Field Name | Description |
|---|---|
| Title | Title of the Report |
| Subtitle | Sub-title for the report |
| Key Filter | Filter toppers in re2 regex format |
| Inverse Key Filter | Inverse toppers in re2 regex format |
| Page surface | Type of bandwidth chart |
| Page type | toppers traffic |
| Counter group | Select the desired counter group |
| Meters | Select the meters such as total,transmit,recieved,etc |
| Max Count | Specify the nunber of toppers to be shown |
Select save option.
To view the report, select the option button near the newly created report. Select Generate report option to generate the report you have created
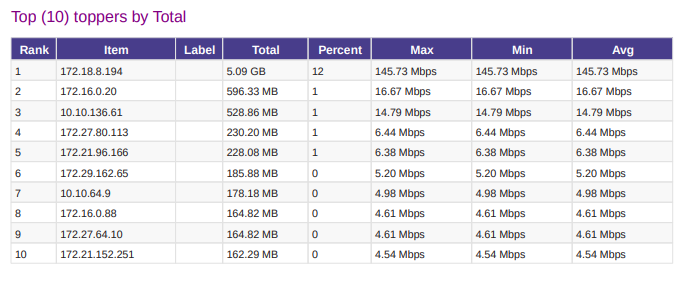
Figure: Sample pdf report for Toppers traffic for hosts counter group
CrossKey Drilldown Report
A Crosskey Drilldown Report in Trisul is a report that provides a detailed analysis of network traffic by correlating multiple keys or dimensions, such as Source IP, Destination IP, Protocol, Port, and Interface.
To create a CrossKey Drilldown report, Click CrossKey Drilldown Report from the option button against the newly created report name under all the custom reports. You will find the following dialog box to fill in.
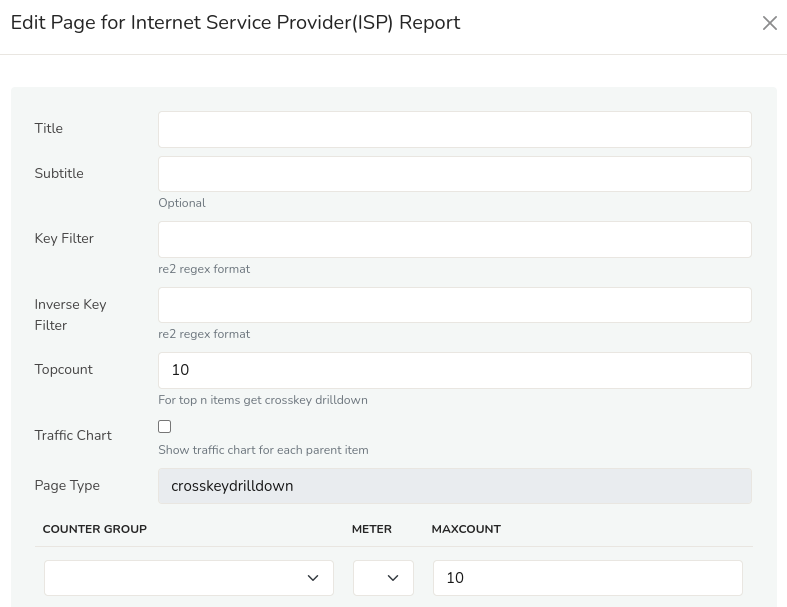
Figure: Search form for CrossKey Drilldown report
Here is the table with description for available fields to create Toppers traffic chart reports.
| Field Name | Description |
|---|---|
| Title | Title of the Report |
| Subtitle | Sub-title for the report |
| Key Filter | Filter toppers in re2 regex format |
| Inverse Key Filter | Inverse toppers in re2 regex format |
| Top Count | Type of bandwidth chart |
| Traffic Chart | toppers traffic |
| Page type | CrossKey Drilldown |
| Counter group | Select the desired counter group |
| Meters | Select the meters such as total,transmit,recieved,etc |
| Max Count | Specify the nunber of toppers to be shown |
Select save option.
To view the report, select the option button near the newly created report. Select Generate report option to generate the report you have created
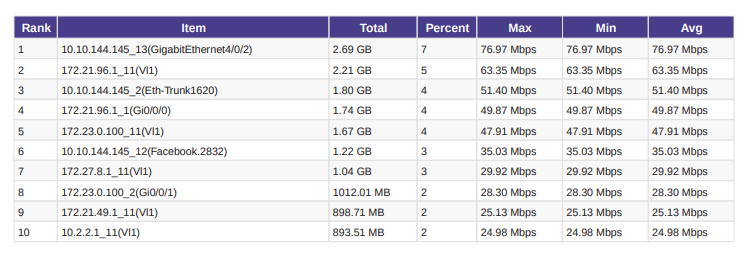
Figure: Sample pdf report for CrossKey Drilldown for FlowIntf_bx_Apps counter group
Metrics Table Report
A Metric Table Report in Trisul is a tabular representation of network metrics, providing a detailed summary of network traffic and performance data. This report displays various network metrics in a table format, allowing for easy analysis and comparison of network activity.
For instance, if you want a volume report for all metrics(total,received,transmit,etc) for a particular counter group for a particular key, we can use metrics table.
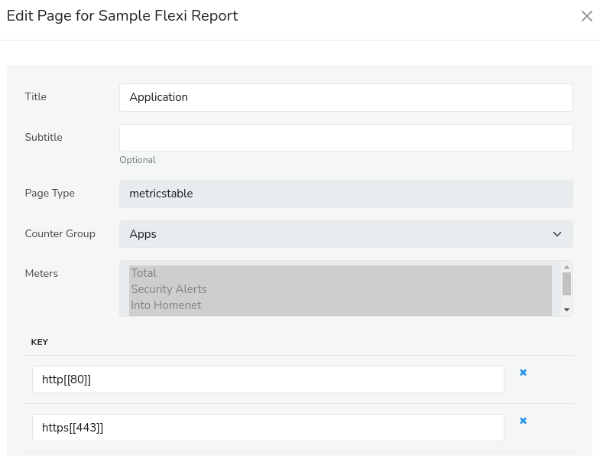
Figure: Search form for Metrics type report
Here is the table with description for available fields to create Metric type reports.
| Field Name | Description |
|---|---|
| Title | Title of the Report |
| Subtitle | Sub-title for the report |
| Page type | metricstable |
| Counter group | Select the desired counter group |
| Meters | Select the meters such as total,transmit,recieved,etc |
| Key | Enter the valid key-format for the metric to be mapped |
If you want to add more keys you can click on the ‘+’ symbol at the bottom of the dialog box.
Select save option.
To view the report, select the option button near the newly created report. Select Generate report option to generate the report you have created.
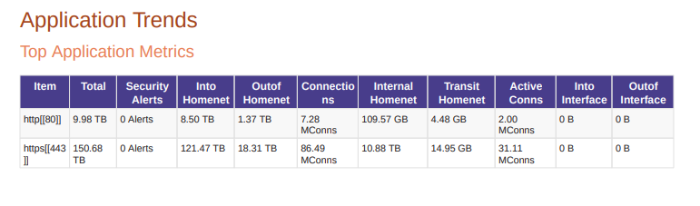
Figure: Sample pdf for Metrics based reports
Alert Count Report
An Alert Count Report in Trisul is a report that displays the number of alerts generated by Trisul's alerting system over a specified time period. Trisul's alerting system monitors network traffic and triggers alerts when predefined conditions or thresholds are met, indicating potential security threats, performance issues, or other notable events. This report is specially for alert based reports.
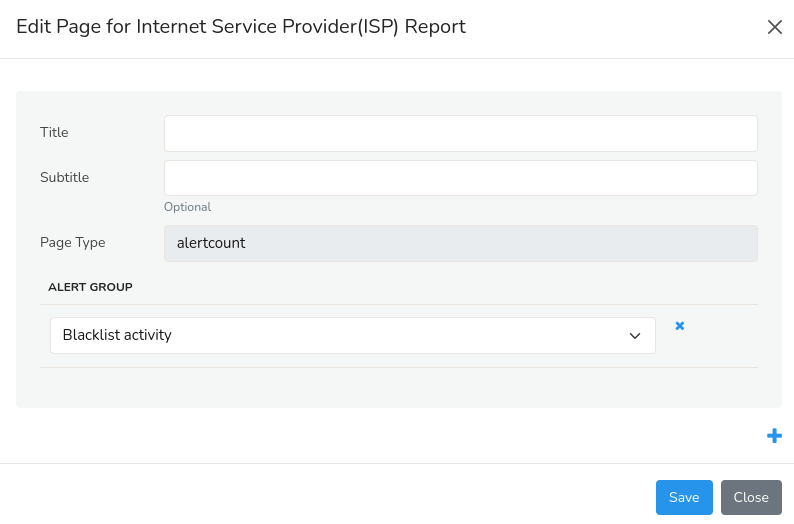
Figure: Search form for alert type report
Here is the table with description for available fields to create Alert type reports.
| Field Name | Description |
|---|---|
| Title | Title of the Report |
| Subtitle | Sub-title for the report |
| Page type | Alertcount |
| Alert group | Select the alert group you want |
If you want to add more alert groups you can click on the ‘+’ symbol at the bottom of the dialog box and select another alert group.
Select save option.
To view the report, select the option button near the newly created report. Select Generate report option to generate the report you have created
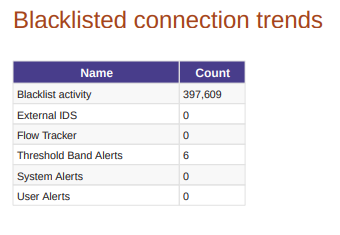
Figure: Sample pdf for alert count reports
Conversations Report
A Conversations Report in Trisul provides a detailed analysis of network conversations between internal and external hosts over a specified time period. This report offers insights into the communication patterns, protocols, and data exchange between hosts on the selected interface.
To create a Conversations report, Click Conversations Report from the option button against the newly created report name under all the custom reports. You will find the following dialog box to fill in.
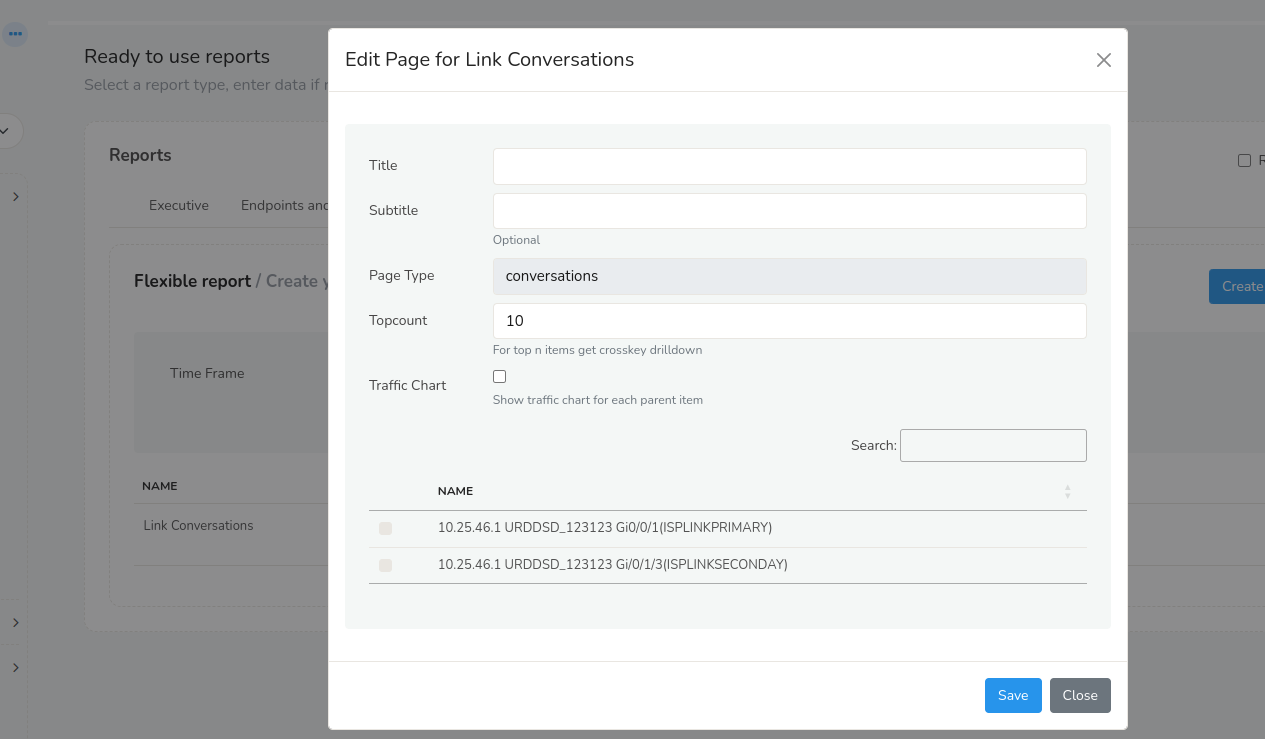
Figure: Conversations Report
Here is the table with description for available fields to create Conversations reports.
| Field Name | Description |
|---|---|
| Title | The main heading of the report, providing a brief summary of the report's content. |
| Subtitle | A secondary heading that provides additional context or information about the report. |
| Page Type | The type of report page, such as a metrics table, alert count, conversations etc. |
| Top Count | The number of top conversations to display in the report. |
| Traffic Chart | Check this checkbox to enable the graphical representation of network traffic patterns, displaying metrics. |
| Search Links | Enter the link name that allows you to quickly search for specific data or filters within the report. |
| Name of the links | All the available links on the interface. (Note: Interface tracker has to be enabled to view the links) To enable Interface tracker see : Interface Tracker |
Click Save
To view the report, select the option button near the newly created report. Select Generate report option to generate the report you have created
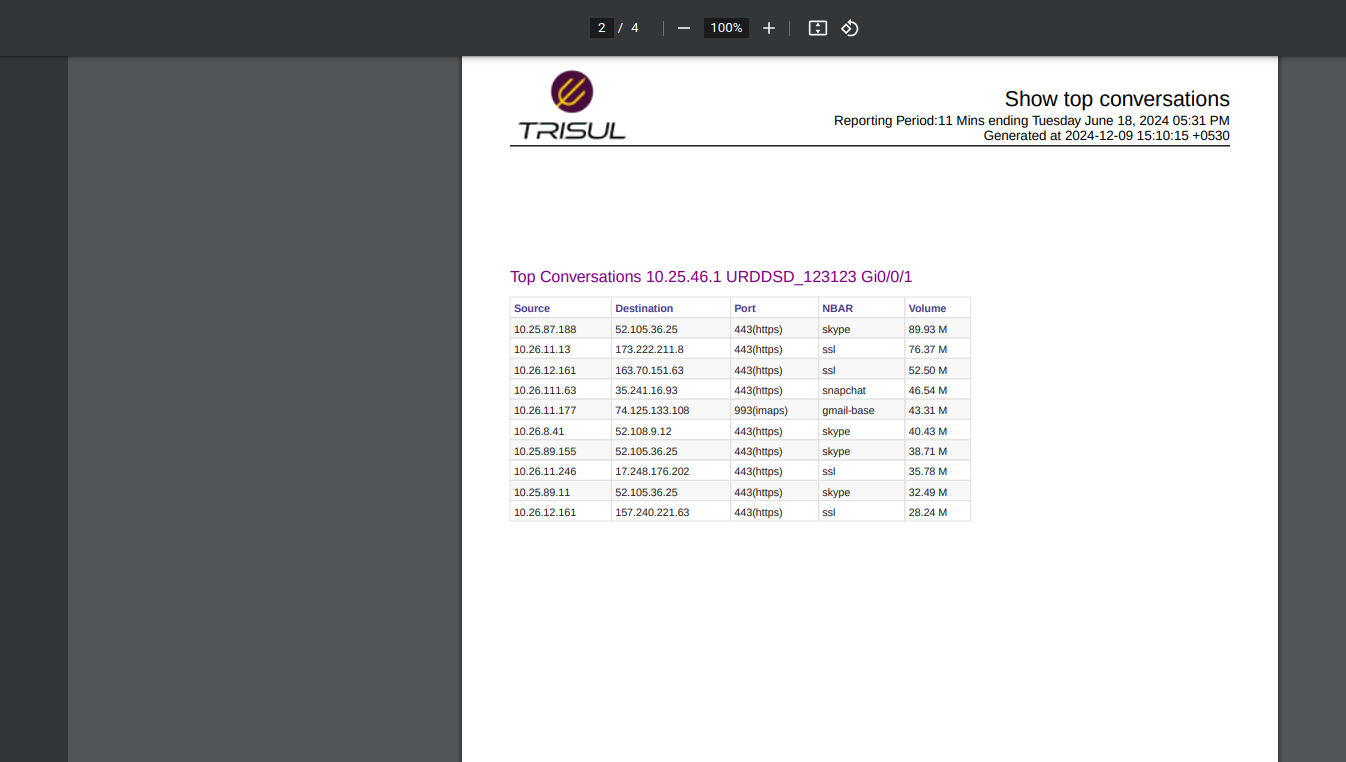
Figure: Sample pdf for Conversations reports
To include port details in the report Enable "Include Dest Port(Conversations)" in NetFlow