Schedule Email Reports
You can have Trisul automatically email reports periodically.
Report Intervals
You may dispatch by email any of the supported report types at these intervals.
- Hourly
- Daily
- Weekly
- Monthly
Schedule a New Report
To schedule a new report
👉 Login as user Go to Reports → Schedule or you can also
👉 Login as admin Go to Context: Default → Admin Tasks → Schedule Email Reports
- A list of all reports scheduled will appear
- Click New report
- Fill out these fields
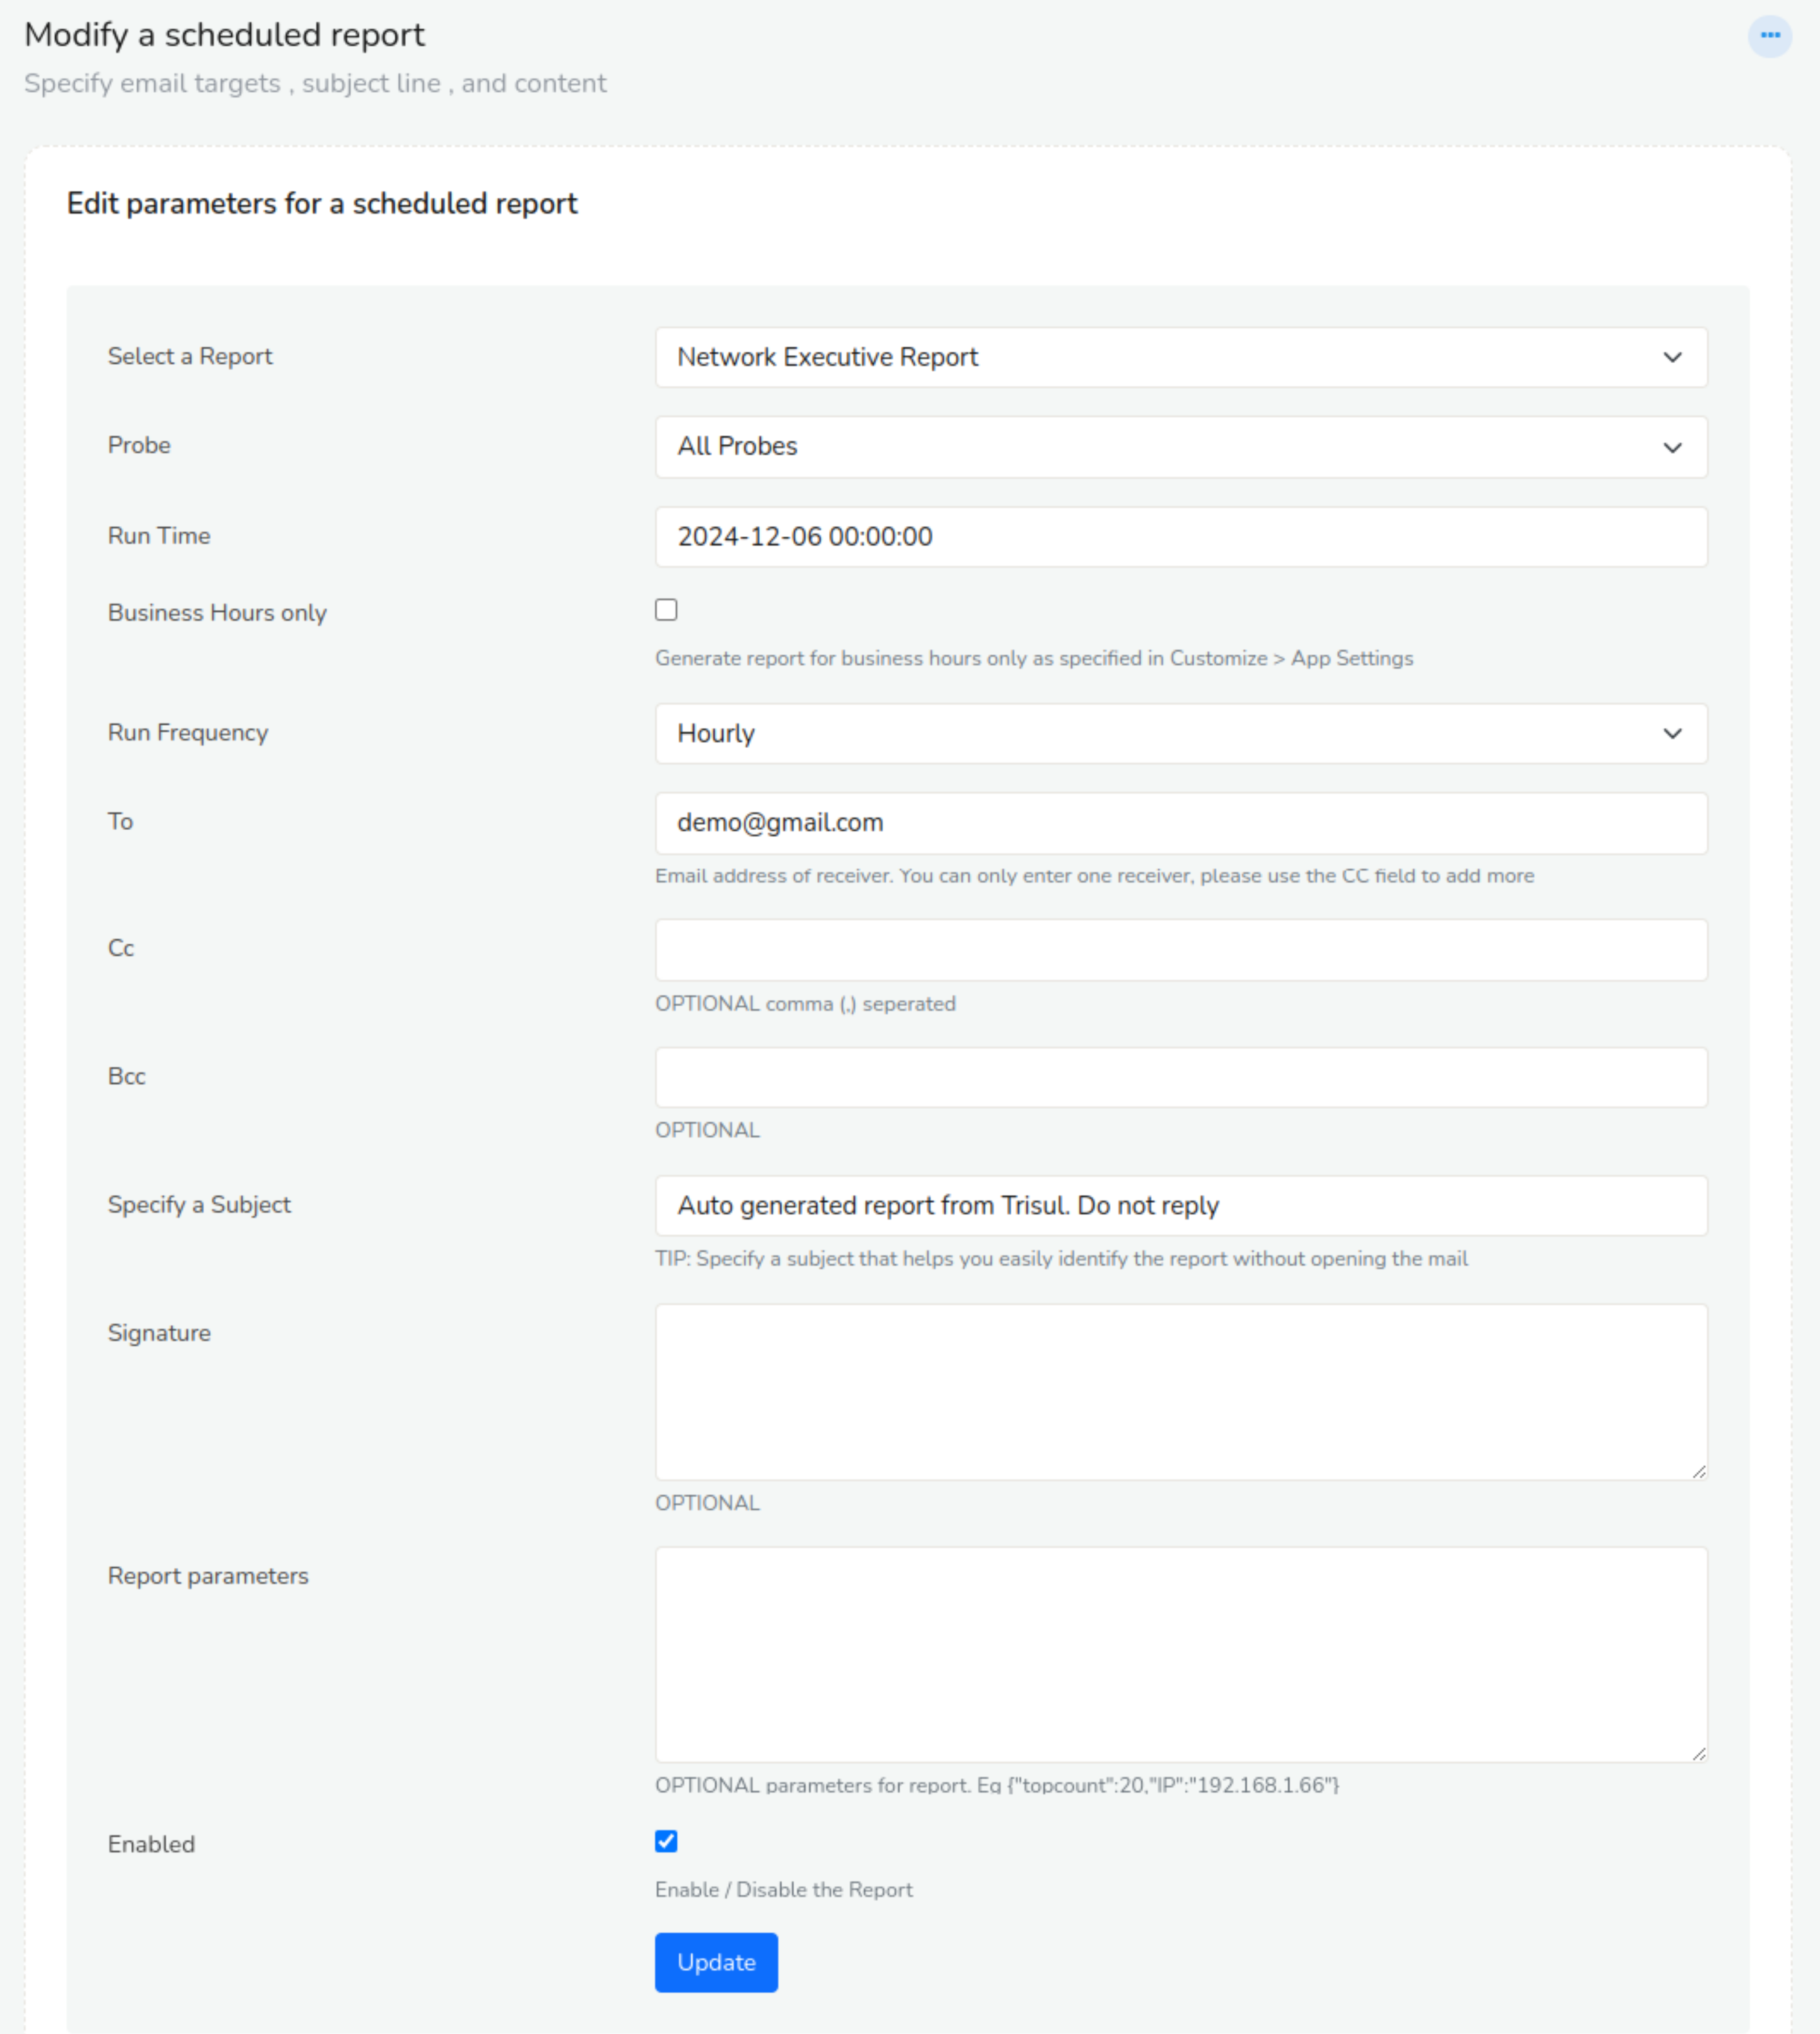
Figure: Showing Schedule a New Email Report Configuration
Here is the table with the description of all available fields to schedule a new report.
| Field Name | Description |
|---|---|
| Select a Report | You can choose various type of reports |
| Probes | You can choose among different nodes if multiple probes are setup |
| Run Time | At the top of what time do you want to run the report. The actual run times of the reports also depends on the frequency. For example if you select “2011-12-20 10:20:00” for hourly report runs. The report will be generated at 10:20, 11:20, 12:20, etc.. |
| Business Hours | Runs the report for business hours only |
| Run Frequency | Select from Hourly,Daily,Weekly, or Monthly |
| To | Email address of receiver |
| Cc | Recipient received a copy of the message. |
| Bcc | Recipients are invisible to all the other recipients of the message |
| Specify a Subject | Subject of the report |
| Signature | Signature of the sender |
| Report parameters (optional) | Optional parameters, if present must be in valid JSON format. This parameter is only required for these three reports Endpoint Activity, Application Activity, Router and Interfaces |
| Enabled | Keep this checkbox checked to generate reports on schedule and unchecked to temporarily disable scheduled reports |
Once you schedule the report, all your scheduled reports will appear on the index page and you can toggle from there.
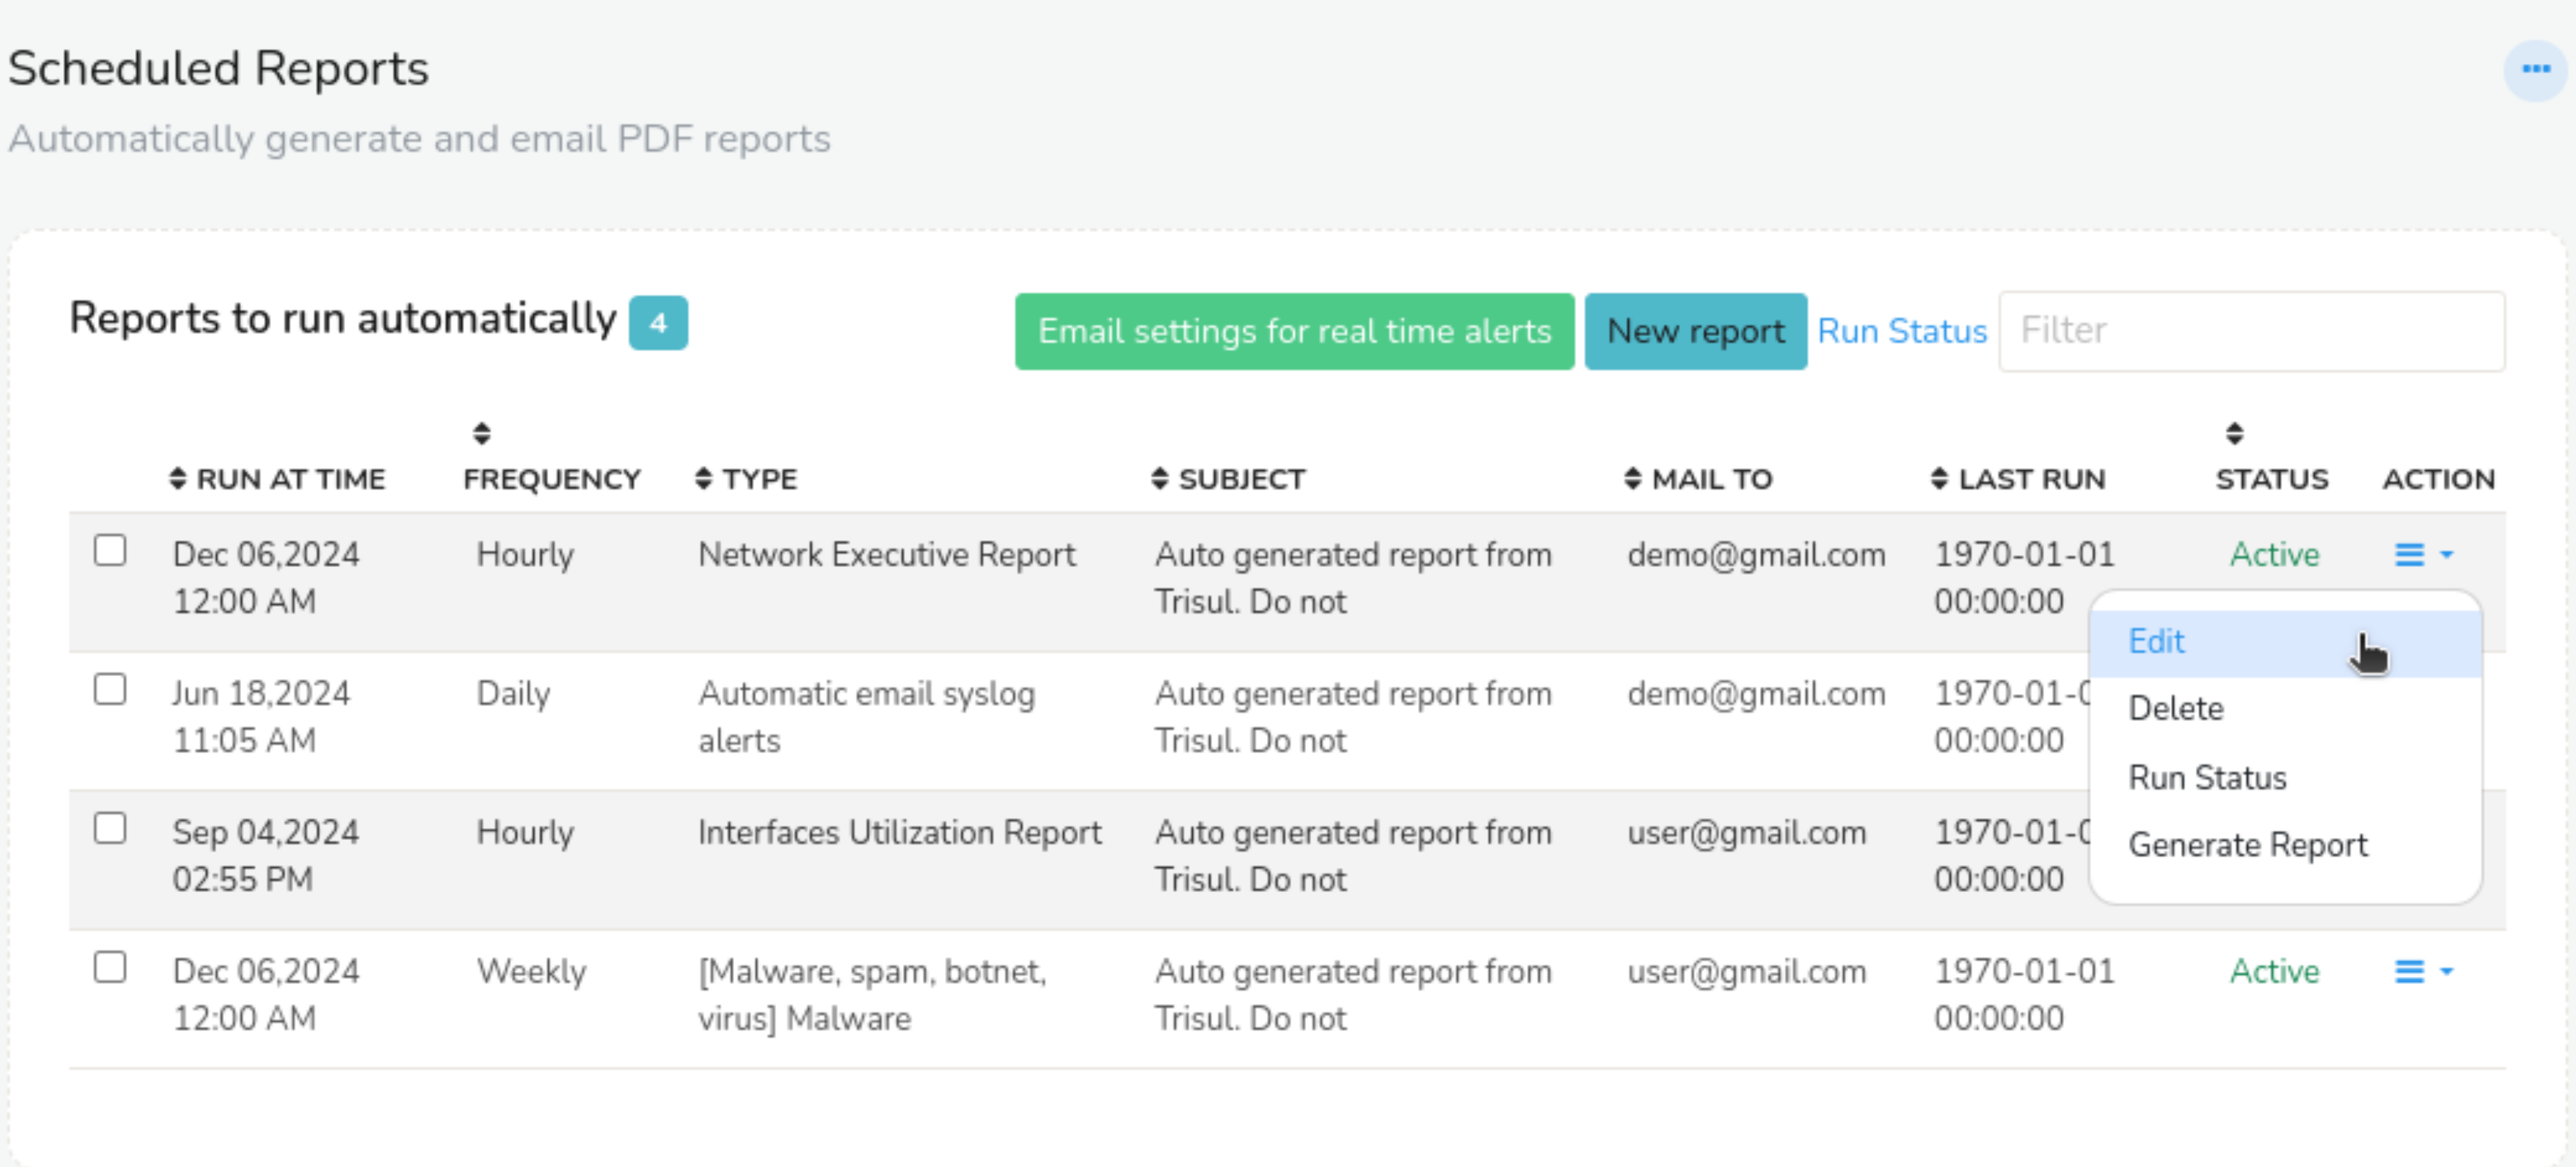
Figure: Showing List of Currently Scheduled Reports in Index Page
The following is the list of options and their description of all scheduled reports you can see on the index page of scheduled reports.
| Options | Descriptions |
|---|---|
| Run at Time | The scheduled time at which the report will be generated and sent. |
| Frequency | The frequency at which the report will be generated and sent, such as daily, weekly, or hourly. |
| Type | The type of report being generated, such as network executive report, automatic email syslog alerts reports etc. |
| Subject | The subject line of the email that will be sent with the report. |
| Mail to | The email address(es) to which the report will be sent. |
| Last Run | The date and time at which the report was last generated and sent. |
| Status | The current status of the scheduled report, such as active or inactive. |
| Action | The actions that can be taken on the scheduled report, such as "Edit", "Delete", or "Run Status". |
With the action button of the scheduled reprots, you can,
- Edit You can edit the parameters of the scheduled report one report at a time.
- Delete You can delete the scheduled report.
- Run Status You can check if the report has been sent successfully to the destination mail address.
- Generate Report You can download the scheduled report manually.
Bulk Edit
To bulk edit scheduled reports select and click on the checkboxes on the left side against each scheduled report.
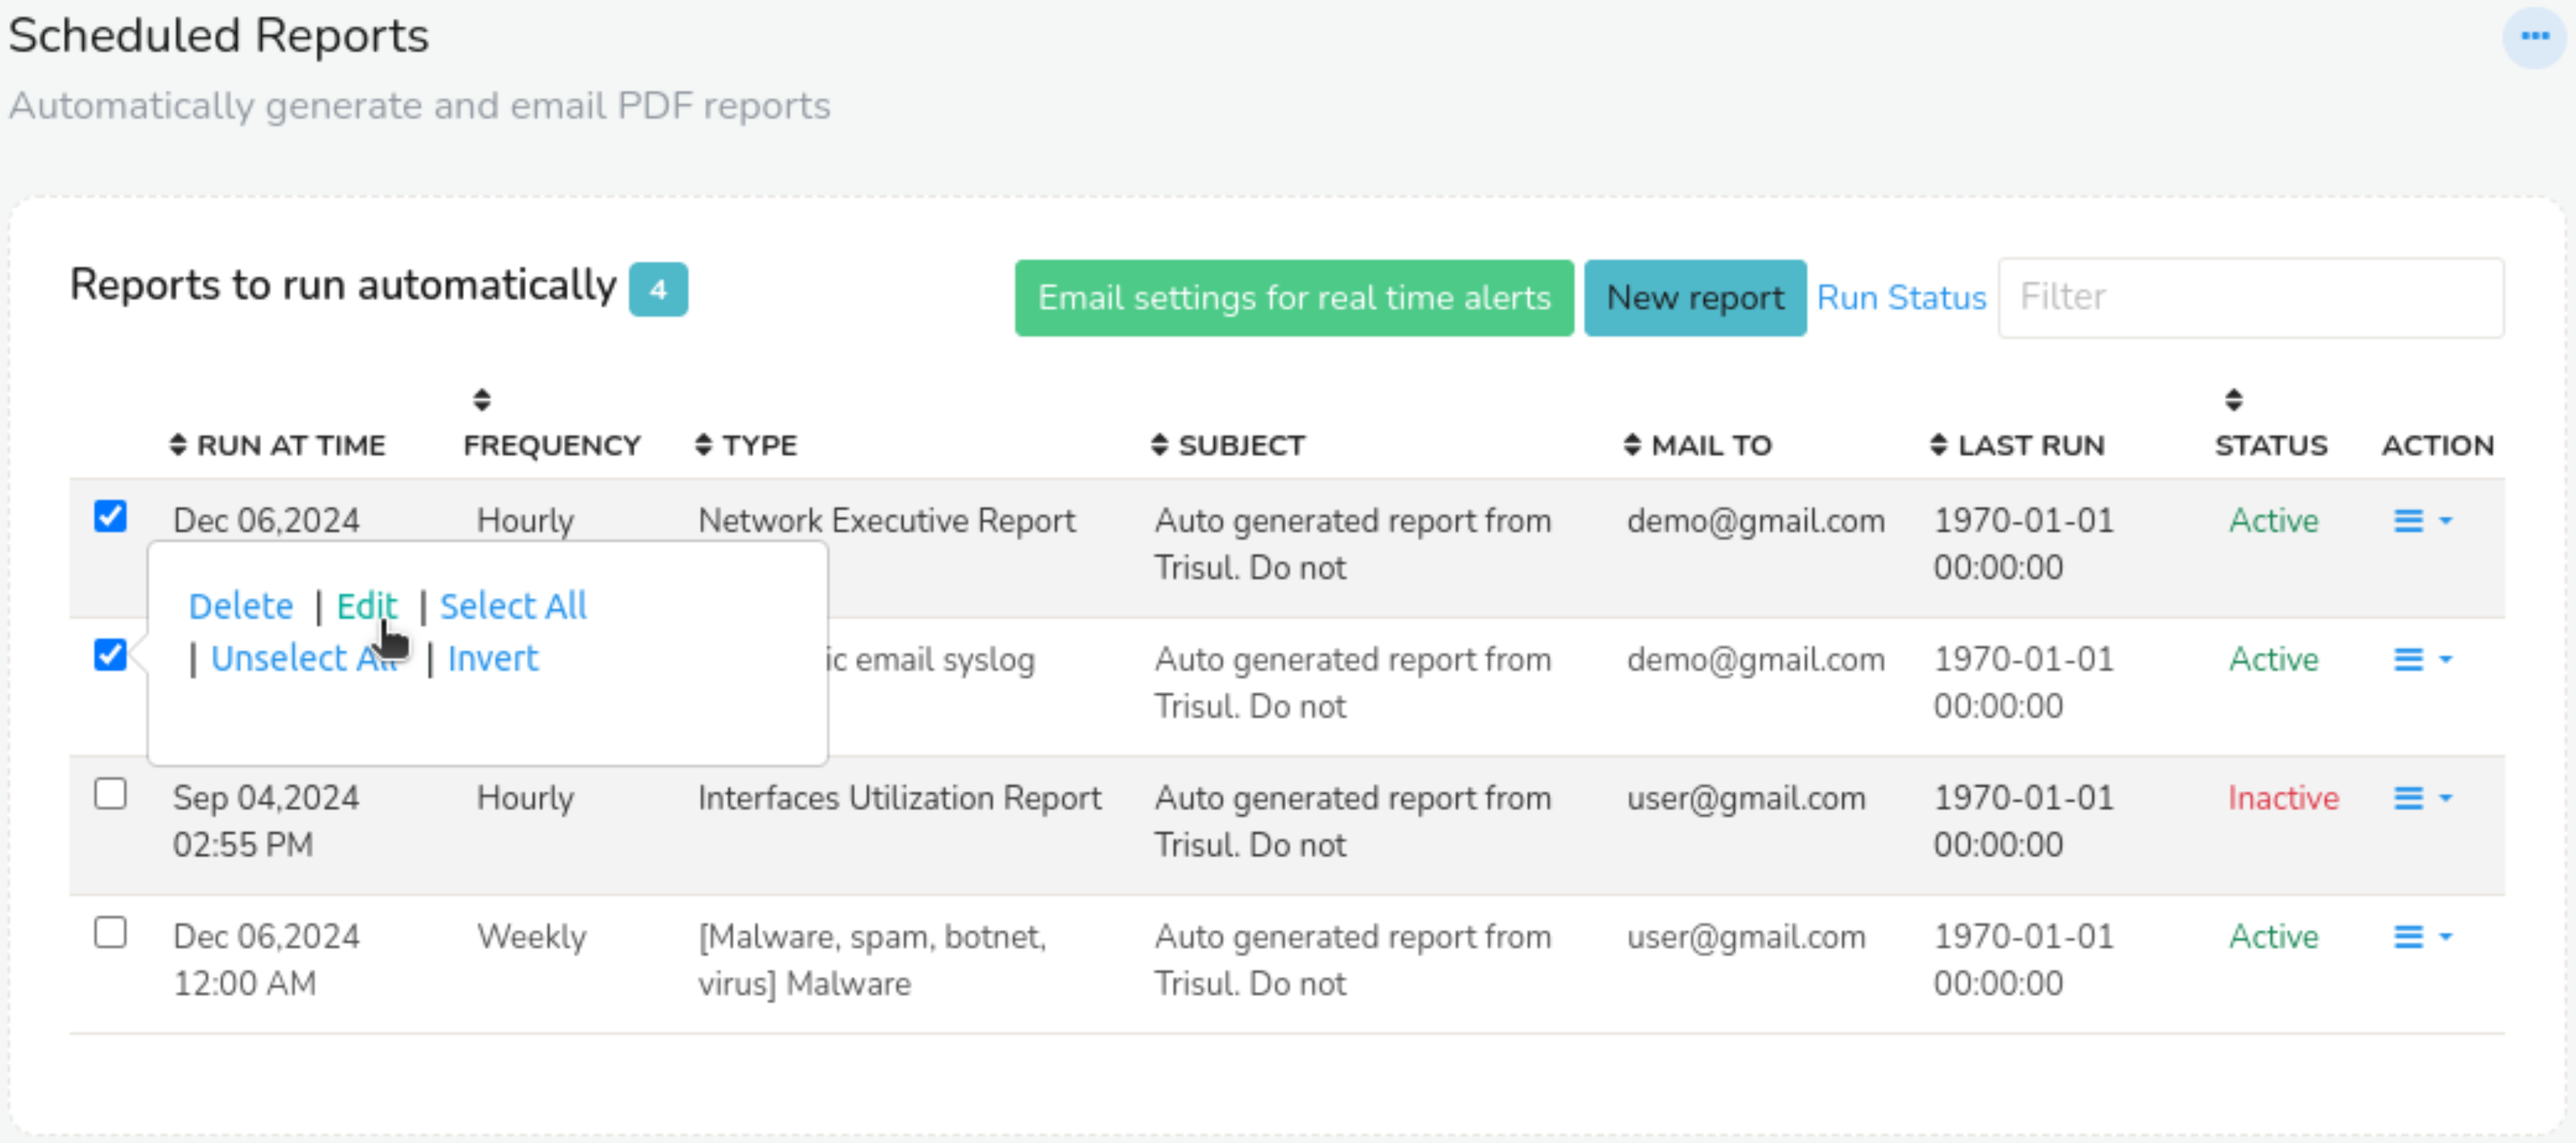
Figure: Bulk Edit Options
- Delete Permanently removes the selected scheduled reports. Use with caution, as deleted reports cannot be recovered.
- Edit Allows you to modify the parameters of the selected scheduled reports.
- Select All Selects all scheduled reports on the page, enabling bulk actions to be applied to all reports at once.
- Unselect All Deselects all scheduled reports on the page, allowing you to start the selection process again.
- Invert Toggles the selection of all scheduled reports on the page, selecting those that were previously unselected and vice versa.
Report Parameters
Some reports are generated for a particular entity such as a specific host or application. For these reports you need to tell Trisul about the entity via the Report parameters field. Currently there are three types of such reports.
Parameters for the Endpoint Activity Report
The Endpoint activity report expects you to specify a host.
- Specify all common fields for a scheduled report
- In addition enter report parameters as shown below
Say you want to schedule an endpoint report for host 192.168.1.151, enter the ip address in this format
{"IP":"192.168.1.151"} You can also enter a host name instead of an IP like {"IP":"dns00.unleashnetworks.com"}
Parameters for the Application Activity Report
The Application activity report expects you to specify an application or port.
- Specify all common fields for a scheduled report
- In addition enter report parameters as shown below
Say you want to schedule an for the http app, use this format {"port1":"http"} You can also enter a port number {"port1":"Port-80"}
Parameters for the Interface Activity Report
Netflow only You can generate a report for any netflow interface.
- Specify all common fields for a scheduled report
- In addition enter report parameters as shown below
Say you want to schedule an report for interface with ifIndex 22 on router 192.168.1.1, use the following format
{"interface":"192.168.1.1_22"}
Enable Email Dispatching
After you have setup email, you need to enable the job that actually generates the report and sends out the email.
To enable this :
👉 Select Customize → App Settings
Check the Automatically email scheduled reports
Note: Ensure you have set up your Email Settings
Troubleshooting
Are your reports not coming through ? Here are some possible reasons.
Check if cron support is available in your system
As root type
crontab -l
Check the Logs
If you are not receiving the email reports, check the logs.
👉 Login as Admin → WebAdmin → View Logs
Click on Background tasks log
You can see if any errors are observed there.
Executive Network Report
The Executive Network Report provides a comprehensive overview of network activity and performance, including:
| Content | Description |
|---|---|
| Bandwidth Utilization | Total bandwidth received and transmitted |
| Alerts | Notifications from threshold crossing alerts, , Flow tracker indicating analysis of network flows to identify trends and patterns, Badfellas for identification of suspicious or malicious hosts, and IDS indicating potential issues |
| Bandwidth Utilization Chart | Visual representation of total bandwidth usage |
| Top Internal Hosts | Most active internal hosts |
| Top External Hosts | Most active external hosts |
| Top Applications | Most used applications |
| Top Network Layers | Most used network layers |
| Top HTTP URL Category | Most accessed URL categories |
| Top Country | Countries with the most network activity |
This report provides a concise and informative snapshot of network performance, security, and usage patterns.
Download Sample Report here : Executive Network Report
Application Activity Report
The Application Usage Report provides a comprehensive overview of application activity and performance, including,
| Content | Description |
|---|---|
| Top Hosts by Total Volume | Ranking of hosts with the highest total data transfer volume |
| Top Applications | Identification of the most frequently used applications |
| Top Server Hosts | List of server hosts with the highest levels of activity |
| Top Client Hosts | Ranking of client hosts generating the most network traffic |
| Top Internal Hosts | Identification of internal hosts with the highest levels of activity |
| Top External Hosts | List of external hosts communicating with the network |
| Top Tags | Categorization of network activity by relevant tags or keywords |
| Top Flows | Analysis of the most prominent network flows, highlighting patterns and trends |
Download Sample Report here : Application Activity Report
Subscriber Activity Report
The Subscriber Activity Report provides a comprehensive overview of network activity and performance, including:
| Content | Description |
|---|---|
| Inbound and Outbound Traffic Chart | Visual representation of incoming and outgoing network traffic |
| TCP Connection Activity | Analysis of TCP connections, highlighting potential issues such as large spikes indicating P2P or infected systems scanning |
| Blacklisted Connection Trends | Aggregate view of malware, spamming, and botnet activity |
| Top 50 Users by Total Traffic | Ranking of users by total uploaded and downloaded traffic |
| Top 50 Users by Connections | Identification of users with the most TCP connections, often indicative of P2P app usage |
| Top 50 Downloaders | List of users with the highest received traffic |
| Top 50 Uploaders | List of users with the highest transmitted traffic |
| Top 50 Potentially Infected | Identification of users hitting malware, virus, phishing, and spamming blacklists |
| Top 50 Apps for Uploads | Applications responsible for the most upload traffic |
| Top 50 Apps for Downloads | Applications responsible for the most download traffic |
Download Sample Report here : Application Activity Report
Malware Report
The Malware Report provides a comprehensive overview of malware activity and performance, including:
| Content | Description |
|---|---|
| Malware Alerts | Identification of potential malware threats |
| Blacklist Matches | Categorization of blacklisted traffic, indicating type of malicious activity |
| Connection Activity with Blacklist Hits | Analysis of connections with known malicious entities |
| ICMP Activity | Monitoring of ICMP traffic, potentially indicating port scanning, PING flood, and other attacks |
| Top 50 Blacklisted Internal Hosts | Ranking of internal hosts with the most blacklist hits, based on malware, virus, phishing, and spamming activity |
| Top 50 Blacklisted External Hosts | Identification of external hosts with the most blacklist hits, based on malware, virus, phishing, and spamming activity |
| Top Alerts Type | Categorization of most common alert types |
| Latest Malware Alerts | List of most recent malware alerts |
Download Sample Report here : Malware Report
Interface Activity Report
The Interface Activity Report provides a comprehensive overview of interface activity and performance, including:
| Content | Description |
|---|---|
| Top Hosts by Total Volume | Ranking of hosts with the highest total data transfer volume |
| Top Applications | Idetification of most frequently used applications. |
| Top Server Hosts | List of server hosts with the highest levels of activity |
| Top Client hosts | Ranking of clients hosts generating the most network traffic |
| Top Internal Hosts | Identification of internal hosts with the highest level of activity |
| Top External Hosts | List of external hosts communicating with the network |
| Top Tags | Categorization of network activity by relevant tags or keywords |
| Top Flows | Analysis of the most prominent network flows, highlighting patterns and trends |
Download Sample Report here : Interface Activity Report
Routers and Interfaces Report
The Routers and Interface Activity Report provides a comprehensive overview of router and interface activity, including:
| Content | Description |
|---|---|
| Router Activity Report Chart | Visual representation of top 20 routers by volume, highlighting network traffic patterns |
| Interface Report Chart | Breakdown of top 2 interfaces for each of the top 20 routers, showing total traffic per interface |
Download Sample Report here : Routers and Interfaces Report
Traffic and Toppers (Internal Hosts)
The Top Toppers and Traffic (Internal Hosts) Report provides a comprehensive overview of network activity and performance, including:
| Content | Description |
|---|---|
| Top Toppers and Traffic by Total | Total top toppers and traffic received and transmitted |
| Newly Seen Top Toppers and Traffic by Total | Newly detected top toppers and traffic patterns |
| Top Toppers and Traffic by Received | Top toppers and traffic received by the network |
| Newly Seen Top Toppers and Traffic by Received | Newly seen top toppers and traffic patterns in received data |
| Top Toppers and Traffic by Transmit | Top toppers and traffic transmitted from the network |
| Newly Seen Top Toppers and Traffic by Transmit | Newly detected top toppers and traffic patterns in transmitted data |
| Top Toppers and Traffic by Total Packets | Top toppers and traffic based on total packets |
| Newly Seen Top Toppers and Traffic by Total Packets | Newly seen top toppers and traffic patterns in packet data |
| Top Toppers and Traffic by Active Connections | Top toppers and traffic associated with active connections |
| Newly Seen Top Toppers and Traffic by Active Connections | Newly detected top toppers and traffic patterns in active connections |
| Top Toppers and Traffic by Attacker Alerts | Top toppers and traffic linked to attacker alerts |
| Newly Seen Top Toppers and Traffic by Attacker Alerts | Newly seen top toppers and traffic patterns related to attacker alerts |
| Top Toppers and Traffic by Homenet | Top toppers and traffic within the homenet |
| Newly Seen Top Toppers and Traffic by Homenet | Newly detected top toppers and traffic patterns in the homenet |
| Top Toppers and Traffic by External | Top toppers and traffic from external sources |
| Newly Seen Top Toppers and Traffic by External | Newly seen top toppers and traffic patterns from external sources |
| Top Toppers and Traffic by TCP SYN Sent | Top toppers and traffic associated with TCP SYN sent |
| Newly Seen Top Toppers and Traffic by TCP SYN Sent | Newly detected top toppers and traffic patterns in TCP SYN sent |
| Top Toppers and Traffic by TCP SYN Received | Top toppers and traffic linked to TCP SYN received |
| Newly Seen Top Toppers and Traffic by TCP SYN Received | Newly seen top toppers and traffic patterns in TCP SYN received |
| Top Toppers and Traffic by Blacklist Alerts | Top toppers and traffic associated with blacklist alerts |
| Newly Seen Top Toppers and Traffic by Blacklist Alerts | Newly detected top toppers and traffic patterns in blacklist alerts |
| Top Toppers and Traffic by Victim Alerts | Top toppers and traffic linked to victim alerts |
| Newly Seen Top Toppers and Traffic by Victim Alerts | Newly seen top toppers and traffic patterns related to victim alerts |
| Top Toppers and Traffic by New Connections | Top toppers and traffic associated with new connections |
| Newly Seen Top Toppers and Traffic by New Connections | Newly detected top toppers and traffic patterns in new connections |
| Top Toppers and Traffic by Incoming Interface | Top toppers and traffic entering through specific interfaces |
| Newly Seen Top Toppers and Traffic by Incoming Interface | Newly seen top toppers and traffic patterns in incoming interfaces |
| Top Toppers and Traffic by Outgoing Interface | Top toppers and traffic exiting through specific interfaces |
| Newly Seen Top Toppers and Traffic by Outgoing Interface | Newly detected top toppers and traffic patterns in outgoing interfaces |
| Top Toppers and Traffic by Flow Records | Top toppers and traffic associated with flow records |
| Newly Seen Top Toppers and Traffic by Flow Records | Newly seen top toppers and traffic patterns in flow records |
| Top Toppers and Traffic by Unused Cardinality Counter | Top toppers and traffic linked to unused cardinality counters |
| Newly Seen Top Toppers and Traffic by Unused Cardinality Counter | Newly detected top toppers and traffic patterns in unused cardinality counters |
Download Sample Report here : Traffic and Toppers (Internal Hosts)
Toppers and Traffic (Applications)
The Toppers and Traffic Report provides a comprehensive overview of network activity and performance, including:
| Content | Description |
|---|---|
| Top Toppers and Traffic by Total | Overall statistics on top toppers and traffic |
| Newly Seen Top Toppers and Traffic by Total | Newly seen top toppers and traffic statistics |
| Top Toppers and Traffic by Security Alerts | Statistics on top toppers and traffic related to security alerts |
| Newly Seen Top Toppers and Traffic by Security Alerts | Newly seen top toppers and traffic statistics related to security alerts |
| Top Toppers and Traffic by Into Homenet | Statistics on top toppers and traffic entering the Homenet |
| Newly Seen Top Toppers and Traffic by Into Homenet | Newly seen top toppers and traffic statistics entering the Homenet |
| Top Toppers and Traffic by Outof Homenet | Statistics on top toppers and traffic leaving the Homenet |
| Newly Seen Top Toppers and Traffic by Outof Homenet | Newly seen top toppers and traffic statistics leaving the Homenet |
| Top Toppers and Traffic by Connections | Statistics on top toppers and traffic by connection type |
| Newly Seen Top Toppers and Traffic by Connections | Newly seen top toppers and traffic statistics by connection type |
| Top Toppers and Traffic by Internal Homenet | Statistics on top toppers and traffic within the Homenet |
| Newly Seen Top Toppers and Traffic by Internal Homenet | Newly seen top toppers and traffic statistics within the Homenet |
| Top Toppers and Traffic by Transit Homenet | Statistics on top toppers and traffic transiting the Homenet |
| Newly Seen Top Toppers and Traffic by Transit Homenet | Newly seen top toppers and traffic statistics transiting the Homenet |
| Top Toppers and Traffic by Active Conns | Statistics on top toppers and traffic by active connections |
| Newly Seen Top Toppers and Traffic by Active Conns | Newly seen top toppers and traffic statistics by active connections |
| Top Toppers and Traffic by Into Interface | Statistics on top toppers and traffic entering through specific interfaces |
| Newly Seen Top Toppers and Traffic by Into Interface | Newly seen top toppers and traffic statistics entering through specific interfaces |
| Top Toppers and Traffic by Outof Interface | Statistics on top toppers and traffic leaving through specific interfaces |
| Newly Seen Top Toppers and Traffic by Outof Interface | Newly seen top toppers and traffic statistics leaving through specific interfaces |
| Top Toppers and Traffic by Unused Cardinality Counter | Statistics on top toppers and traffic related to unused cardinality counters |
| Newly Seen Top Toppers and Traffic by Unused Cardinality Counter | Newly seen top toppers and traffic statistics related to unused cardinality counters |
Download Sample Report here : Traffic and Toppers (Applications)
System Health Report
The System Health Report provides a comprehensive overview of the Trisul deployment’s operational status, resource usage, and component health. It includes the following key sections:
| Content | Description |
|---|---|
| Overall System Health Summary | Shows the global health status of the Trisul system, including the condition of disk, memory, hub, probe, flow flushing, routers, and IPDR services. |
| Disk Usage Status | Detailed usage statistics for each configured storage area, including total size, used and available space, percentage utilization, mount paths, and configured vs. available counter counts. |
| Memory Usage | Summary of total system memory and breakdown of memory consumption between Trisul processes and the underlying system. |
| Process Running Status | Displays the operational status of core Trisul components such as Hub, Probe, and IPDR to confirm whether they are active and running as expected. |
| Last Flushed Count | Reports the most recent flush activity for flows and routers, showing the timestamp and the number of items flushed. Useful for verifying that data processing is up-to-date. |
| Available Time | Indicates the total duration of available monitoring history, showing the earliest retained timestamp up to the latest captured time. |
Download Sample Report here : System Health Report