Multicast GraphX
Multicast GraphX is an interactive visualization tool that helps you explore multicast traffic patterns in your network. It displays a clear and organized layout using D3.js, showing which IPs are sending and receiving multicast data.
Multicast is common in networks that distribute market data and other real-time feeds, such as those of financial services and securities organizations.
Downloading Multicast GraphX
Login as admin and,
👉 Go to Web Admin → Manage → Apps
From the list of Trisul apps, download Multicast GraphX.
Note: Make sure the IGMP Multicast app is also installed and active.
Multicast GraphX works only in packet mode (Trisul NSM).
Viewing Multicast GraphX
Login as user and,
👉 Go to Dashboards → Show all → Multicast GraphX
Using Multicast GraphX
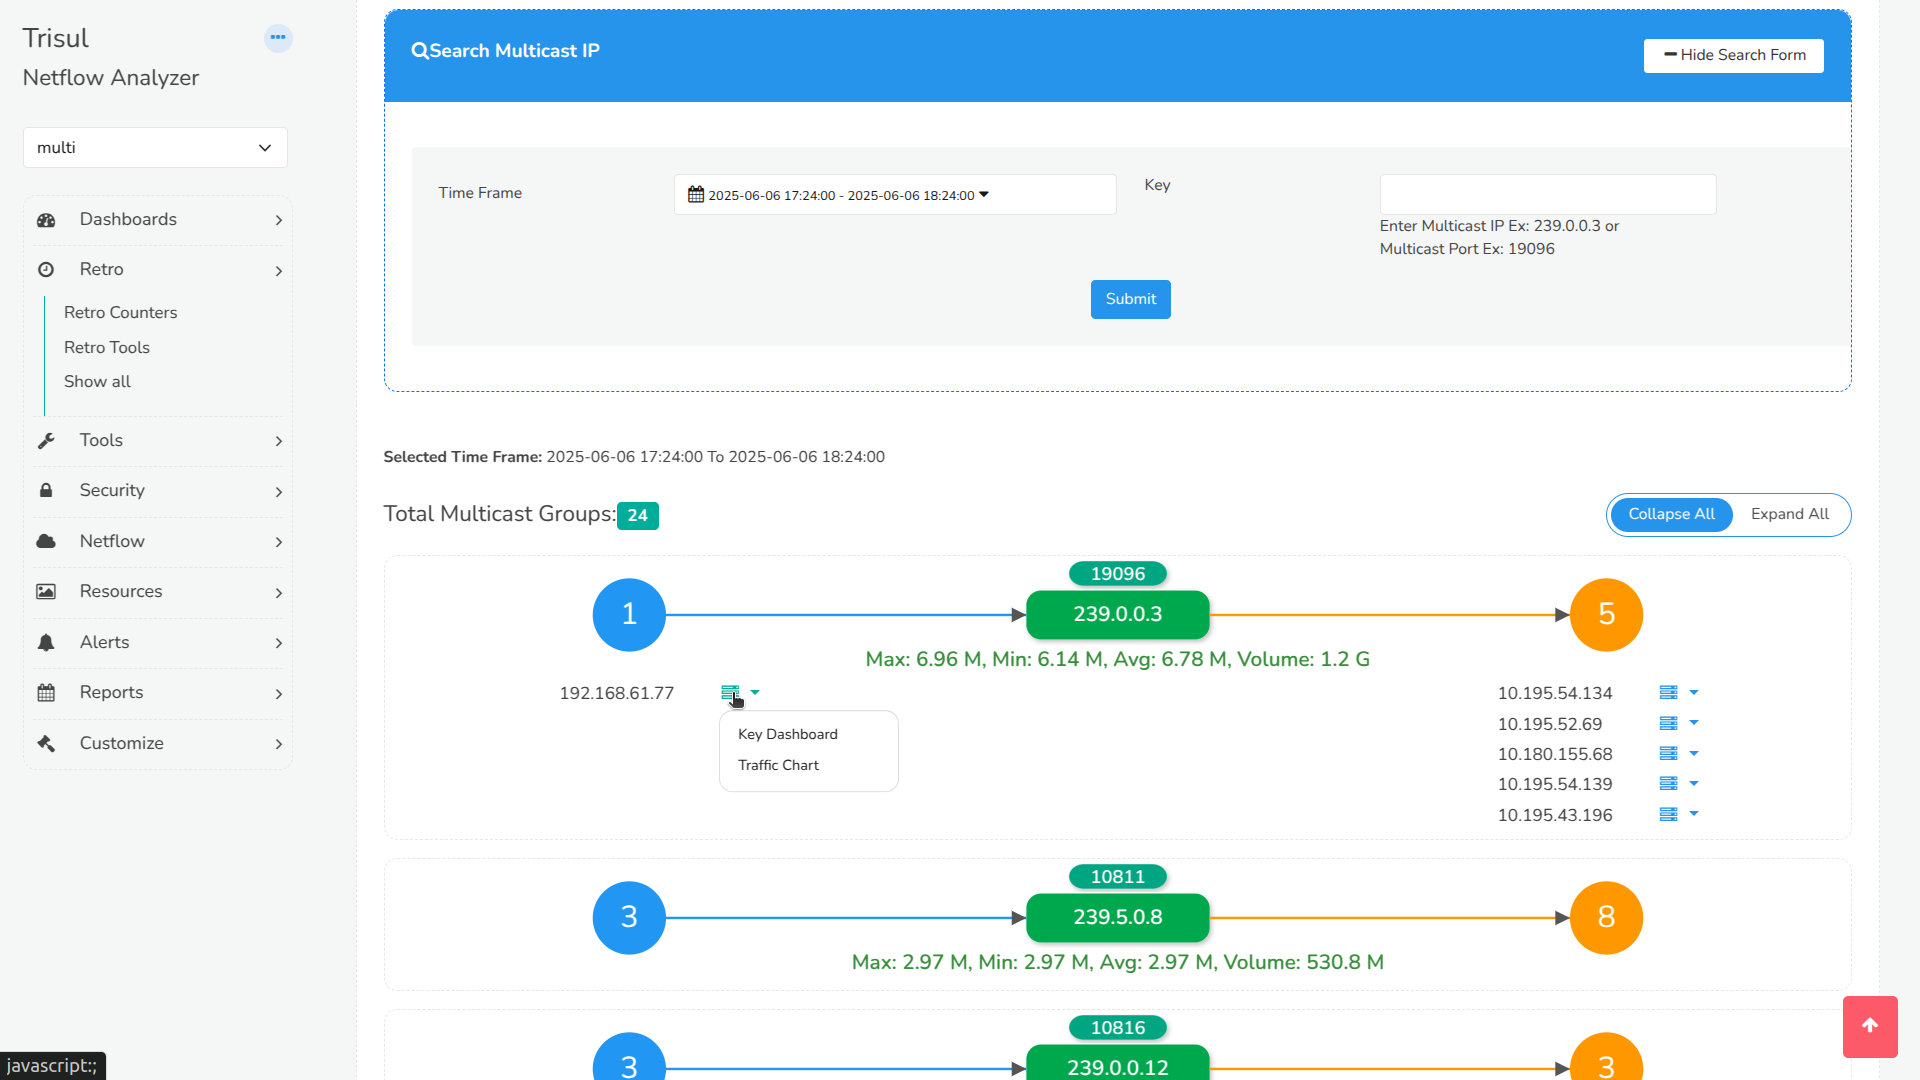
Figure: Showing Multicast GraphX
-
Select a time range to view historical multicast activity.
-
Choose a Counter Group from the dropdown (e.g., Host, ASN).
The graph displays:
-
A center node showing the Multicast IP and Port
-
A left bubble representing the number of sender IPs
-
A right bubble representing the number of receiver IPs
Click on either bubble to expand the list of senders or receivers.
Each sender or receiver in the list provides a dropdown menu with:
-
Traffic Chart – view bitrate over time
-
Key Dashboard – jump to a detailed Trisul dashboard for that IP
Traffic Statistics
For each multicast group, you can also view:
-
Maximum, Minimum, and Average bitrate
-
Total Volume of data transferred
Enhanced View for ASN Groups
If the selected Counter Group is ASN, the interface also shows logos of well-known Autonomous Systems, such as Microsoft and Google, so you can identify top ASNs at a glance.