Long Term Traffic
The Long Term Traffic Tool in Trisul allows you to analyze and visualize network traffic patterns of a particular item over extended periods, typically weeks, months, or even years. This feature is also available on the Module templates if you would like to monitor long term traffic of a particular item on a regular basis.
How to Use
To use long term traffic tool,
👉 Go to Tools → Select Long Term Traffic
The following search criteria window opens up with a Hide/ Show Search Form option.
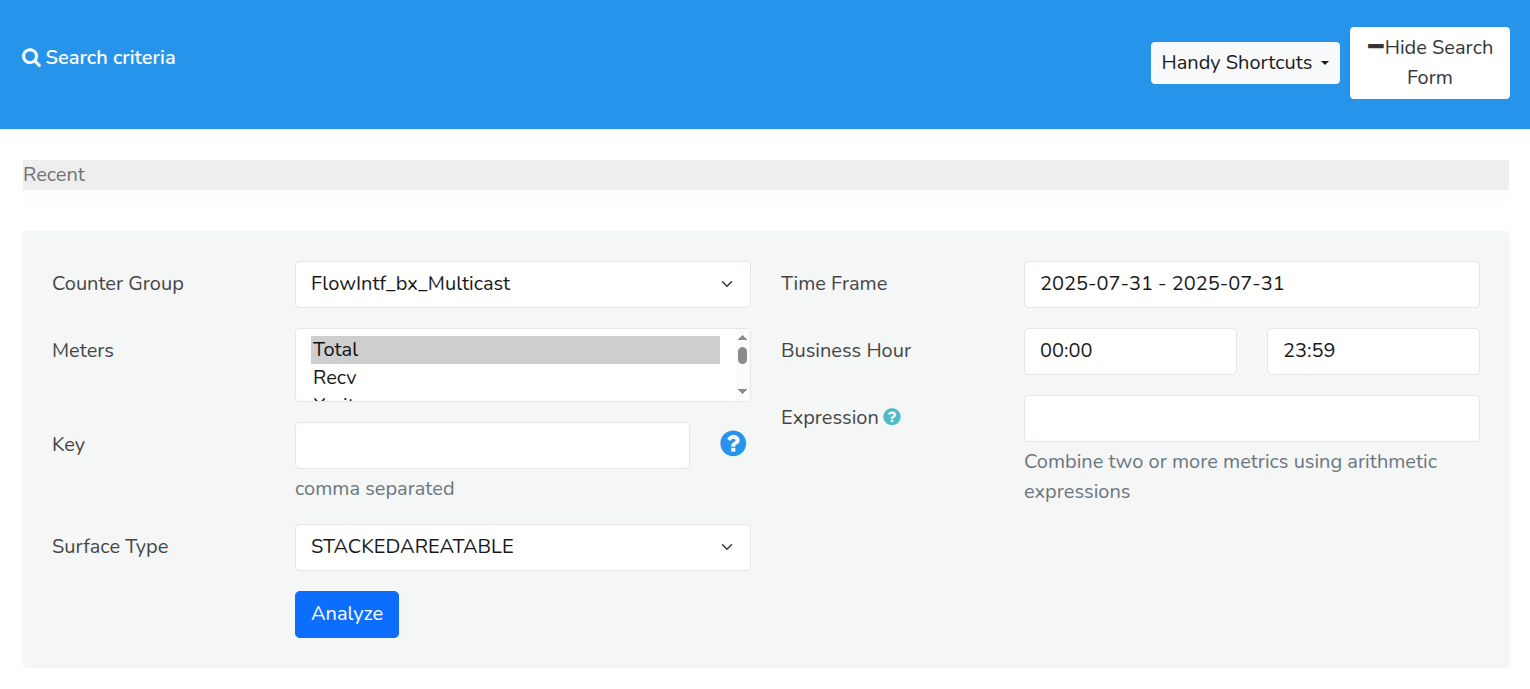
Figure: Long Term Traffic
You can begin your search in the Long term traffic form by populating the search criteria fields with the help of the following fields and their descriptions.
Search Criteria
| Field | Description |
|---|---|
| CounterGroup | Select a counter group to define the type of traffic data to display(example, ASN, Hosts, Apps, etc.) |
| Meters | Choose a meter to focus on specific aspects of network traffic |
| Item | Select an item to specify the entity for which you want to display traffic data (example, a specific IP address, port, protocol) |
| Surface Type | Select the type of chart to display. Tip : Choose LINETABLE if you want to see a box with MAX/MIN/AVG below chart |
| Time Frame | Define the time range for the chart |
| Business Hour | You can specify the business hours for accurate statistics |
| Expression | Combines two or more metrics using arithmetic expressions. Click on the question mark icon near the field name for a quick hint |
Once filling all the fields, click Analyze.
Handy Shortcuts
The Handy Shortcuts option, located on the upper right side of the top bar, provides readymade templates for frequently used analyses of long-term traffic data for a specific item, serving as a convenient tool for quick insights.
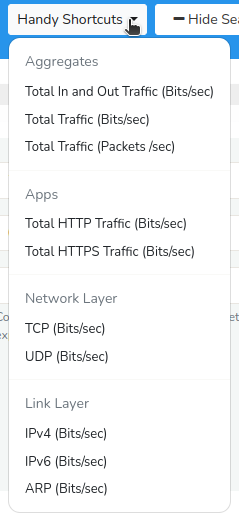
Figure: Handy Shortcuts
Instead of filling in all the fields for the search criteria, you can also simply choose from one of the options from the handy shortcuts and click Analyze.
Search Result
Upon submitting the search criteria form after clicking the analyze button, the system generates a visual representation of the search results in the chart format selected by you.
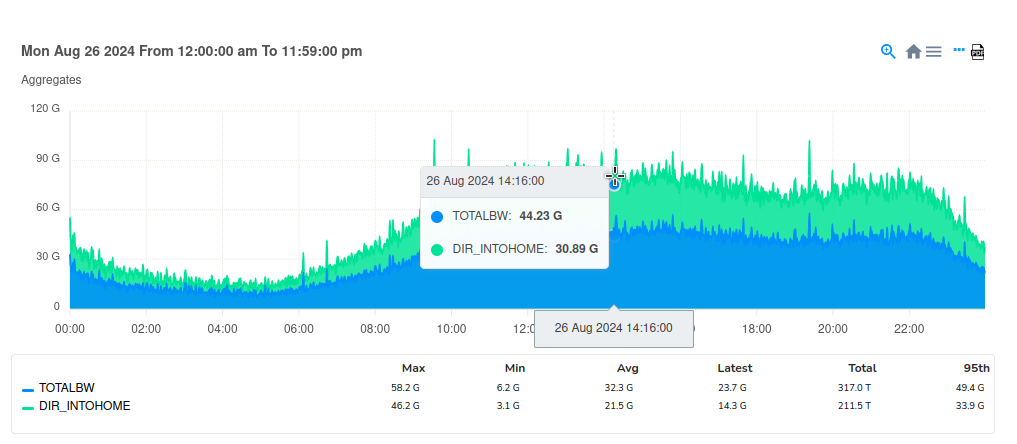 Figure: Long Term Traffic Search Result
A series of charts will be generated, with each chart representing a discrete daily dataset, resulting in a collection of individual charts, one for each day within the specified time frame(example, for 25 days), thereby providing a sequential visual representation of the data. If the specified time frame exceeds the Set Limit, you ll see an aggregated long term chart as a single chart for the set time period.
You can set the number of days for which you want to see the data as individual charts in WebTrisul Options → Charts → Long Term Chart Day Limit.
Using the legend table and Chart Interaction Controls, you can drill down into the intra-day data, facilitating a more detailed temporal analysis and exploration of the search result.