Interface Drilldown
Describes the Interface drilldown tool that appears when you select “Drilldown” against any interface in the Interfaces table of the Routers and Interfaces Tool. The options in Interface Drilldown tool looks slightly different on each interface depending on if Interface Tracking is enabled on the interface or not.
Without Interface Tracker
This is the screen of your interface without tracker that shows the tabs including Traffic, Util, Flow Hosts, Flow Apps, Conversation, Raw Flows and Matrix. Without interface tracker the "Flow Hosts" and "Flow Apps" shows the totals of Host and Apps In/Out/Total but you will not be able to see Time Series trends of those counters.
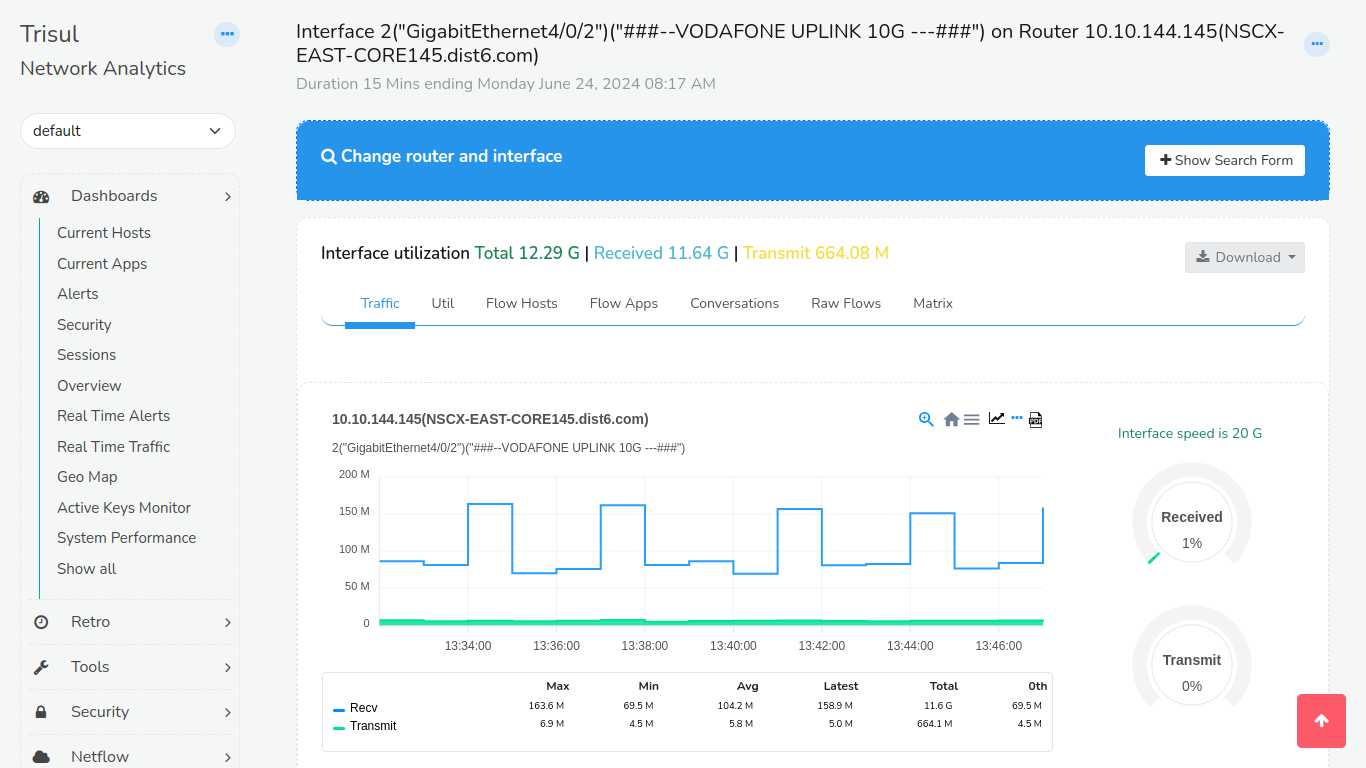
Figure: Interface Utilization with Interface Tracker Disabled
With Interface Tracker
When the interface has the tracker enabled it is indicated by the Eye icon on the additional tabs such as Hosts Track/Apps Track as shown below.
![]()
Figure: Interface Utilization with Interface Tracker Enabled
Using
👉 Select Drilldown against any Netflow interface in the Routers and Interfaces Tool
The following page that contains the traffic chart is displayed.
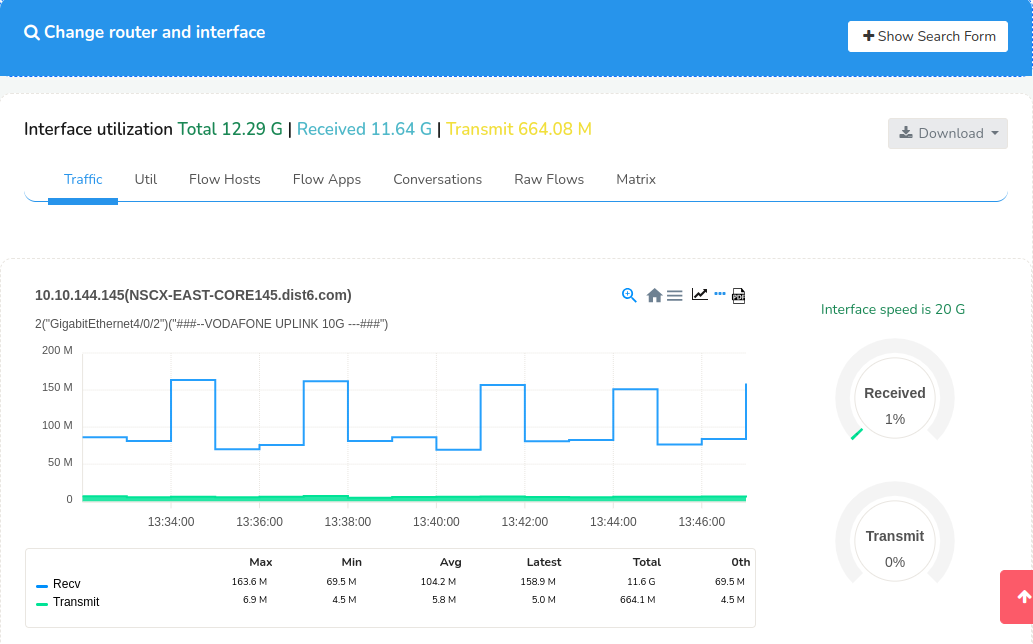
Figure: Interface drilldown Showing the form for Time, Router, Interface selection
Search Form
Click the Show Search Form on the top right to open up a form where you can control the following.
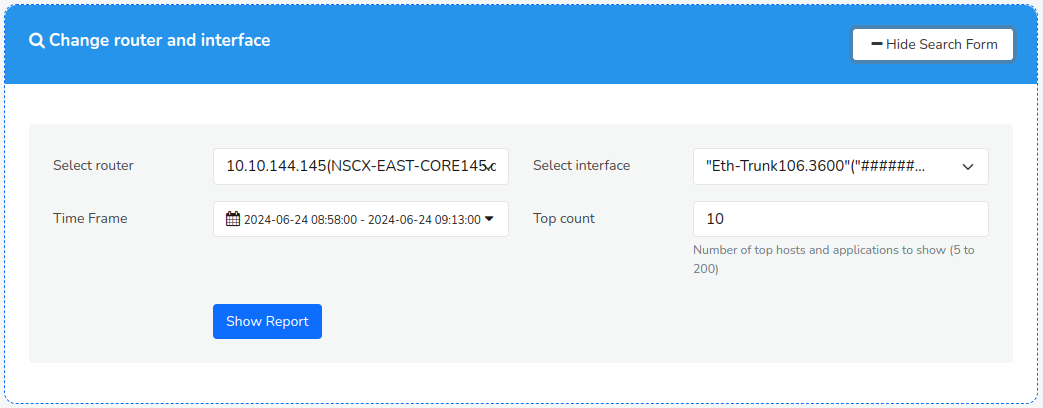
Figure: Show Search Form to Change Router and Interface
You can change the router, interface, time interval, and topper count.
| Field | Description |
|---|---|
| Select Router | Change the router, this loads the interface names on that router |
| Select Interface | Select the interface for which you want drilldown report |
| Time Frame | Change the time interval for the report |
| Top Count | Controls how many Top items are shown in topper views of Hosts, Apps, Conversations etc |
Once the "Change router and interface" form is set and submitted , it takes you to the Interface utilization window.
Information Shown
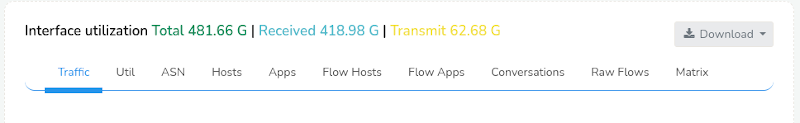
Figure: Interface Utilization Tabs
On top of the tabs you can see the interface utilization data that includes,
Volumes
Shows Total, Received, and Transmitted volumes on the interface
Download
Allows you to download the drilldown report as PDF or XLSX worksheets
Below the title, the interface drilldown is displayed as tabs. Some of these tabs are dynamically created. If you have created a Crosskey Counter Group with Flow-Interfaces as the first group, then the second group will be shown as a Tab.
| Panel | Name | Description |
|---|---|---|
| 1 | Traffic | Bandwidth usage of Recv and Xmit from the interface along with total volumes |
| 2 | Util | Utilization of the interface in transmit and receive directions |
| 3 | ASN | ASNs active on this interface. Needs the ASN Tracker enabled |
| 4 | Hosts | Top hosts into and out of the interface. If Interface Tracker is enabled you will see more accurate numbers and also a traffic chart. If Track Hosts is enabled you will see more details as well. |
| 5 | Apps | Top applications into and out of the interface. More detail and chart available if interface tracking is enabled or if Track Apps is enabled |
| 6 | Flow Hosts | Computes the hosts using this interface by querying raw flow information |
| 7 | Flow Apps | Computes the hosts using this interface by querying raw flow information |
| 8 | Conversations | Top IP source destination and destination port. |
| 9 | Raw Flows | Top Raw flows |
| 10 | Matrix | A chord diagram showing interface to interface traffic flows in transmit and receive directions. This is useful for ISPs, needs the Track interfaces per Interface |
| 11 | ASN, NBAR, QoS etc | These appear dynamically depending on whether these features are enabled or not |
| 12 | MixedBandwidth | ISP specific use case shows the same data as ASN but groups them into cache traffic vs internet traffic |
Also see : Netflow Wizard Trackers
Traffic Chart
Traffic chart shows the transmited and received traffic on the interface for the selected time window. The legends on the bottom show the LATEST values.
Figure: Showing the transmit and receive chart of Interface
Util
Similar to traffic numbers, this tab shows Utilization numbers relative to interface speed.
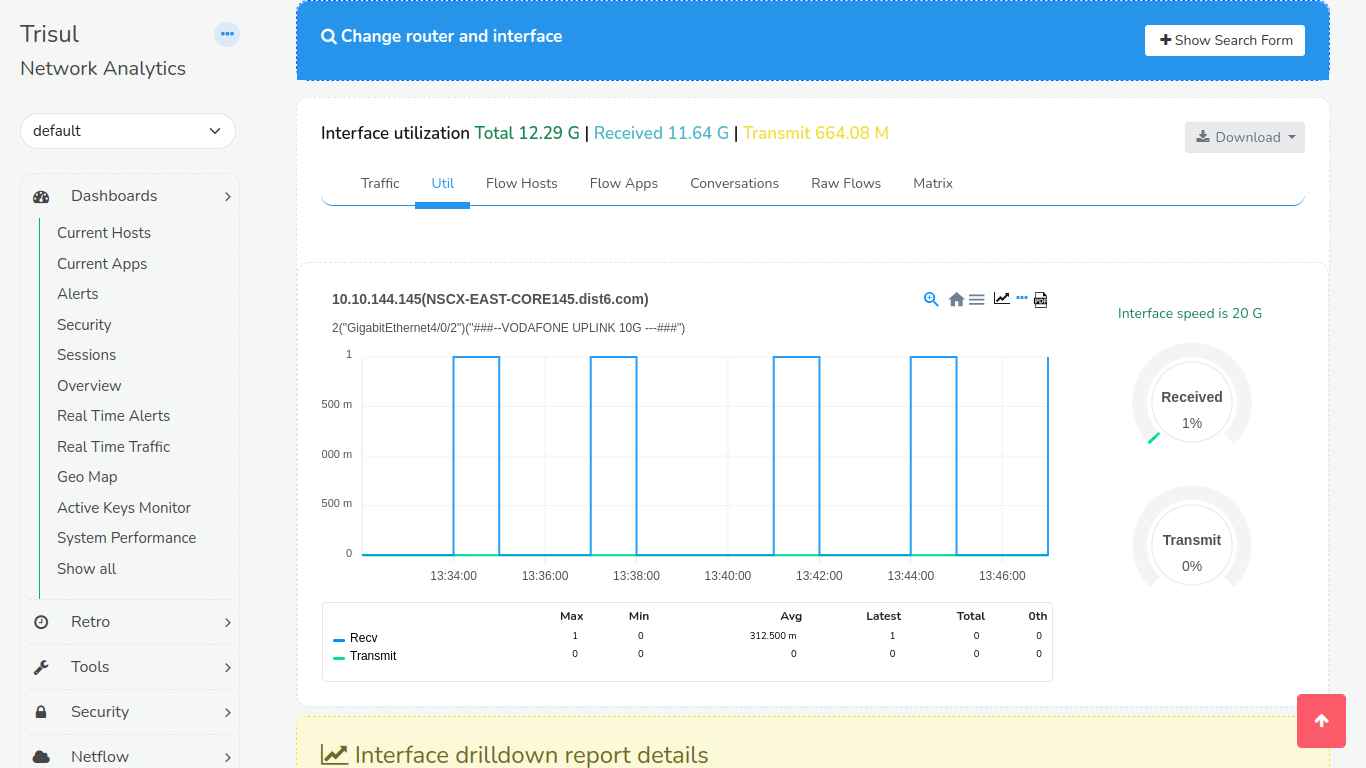
Figure: Util Tab of Interface Utilization
Hosts
For IP based reporting.
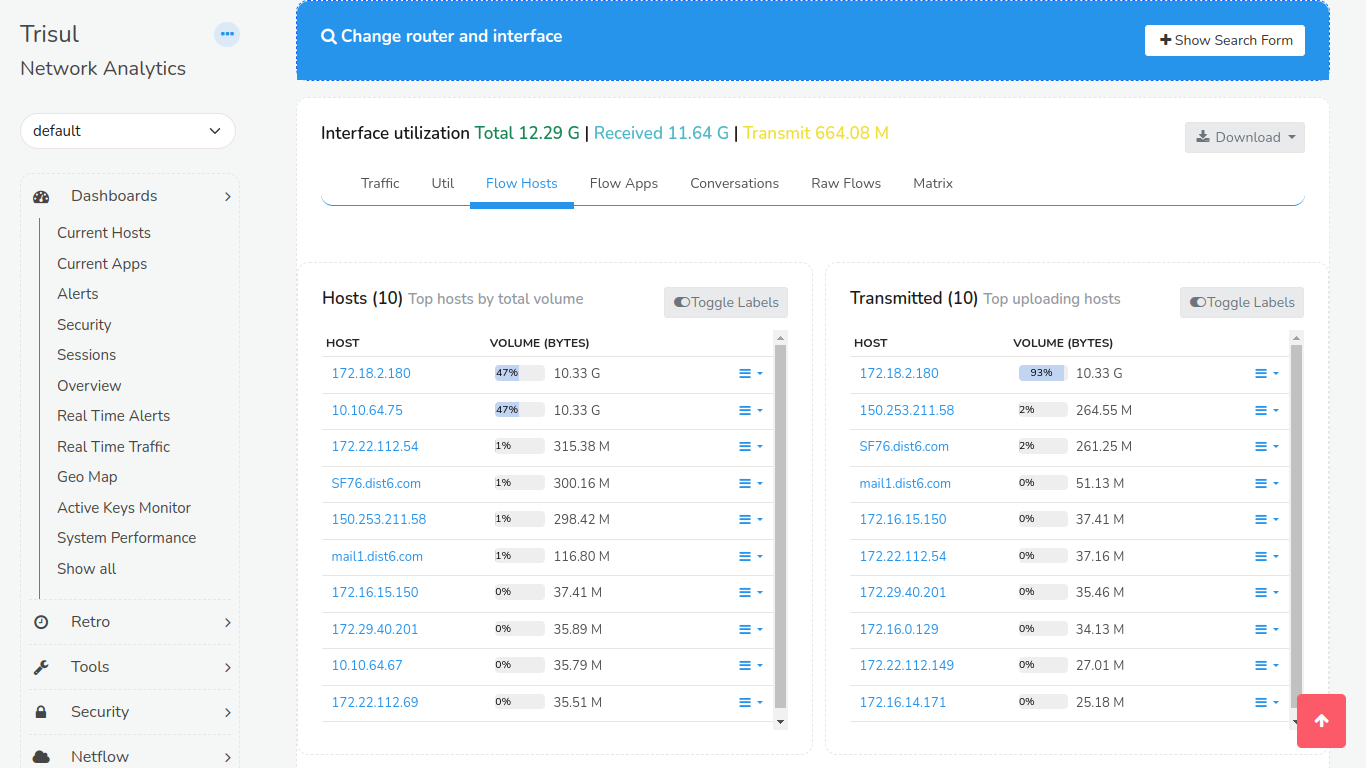
Figure: Flow Hosts Tab of Interface Utilization
Hosts Track (When Interface Tracker is Enabled)
Shows Top N Hosts IP addresses sending or receiving traffic on the interface.
Sample Hosts Trends Chart When Interface Tracker is Enabled
This feature in trisul is a deep drilldown of top hosts by total,into and out of an interface. This is only available after enabling Interface Tracker .
Top hosts into interface are the hosts that are transmitting into the
interface(Ingress)
Top hosts out of interface are the hosts that are transmitting out of
the interface(Egress)
On the right side,we have the traffic chart which helps you to detect the hosts that are causing spikes.
![]()
Figure: Hosts Track Tab of Interface Utilization
Apps
Default Top Apps Report
Shows top applications by receive and transmit on the interface.
Sample Apps Trends Chart
This feature in trisul is a deep drilldown of top applications by total,into and out of an interface. This is only available after enabling Interface Tracker .
![]()
Figure: Apps Track Tab of Interface Utilization
Top Conversations or Talkers
Top conversations are nothing but the talkers. The screen displays the conversations between the source and the destination in volume bytes.
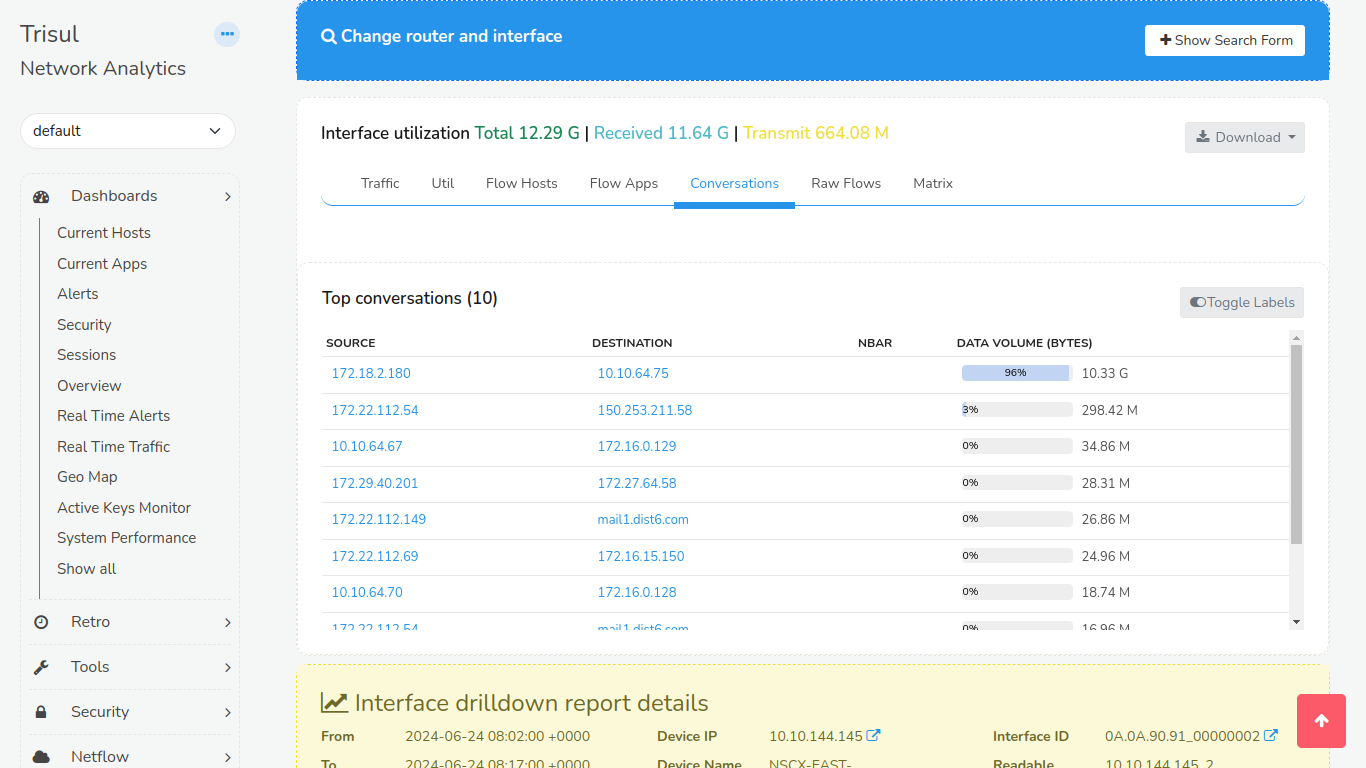
Figure: Conversations Tab of Interface Utilization
Raw Flows
Raw Flows shows details against every flow sorted by volume. It contains information like protocol,source IP, source port, destination IP, destination port, duration of flows, etc.
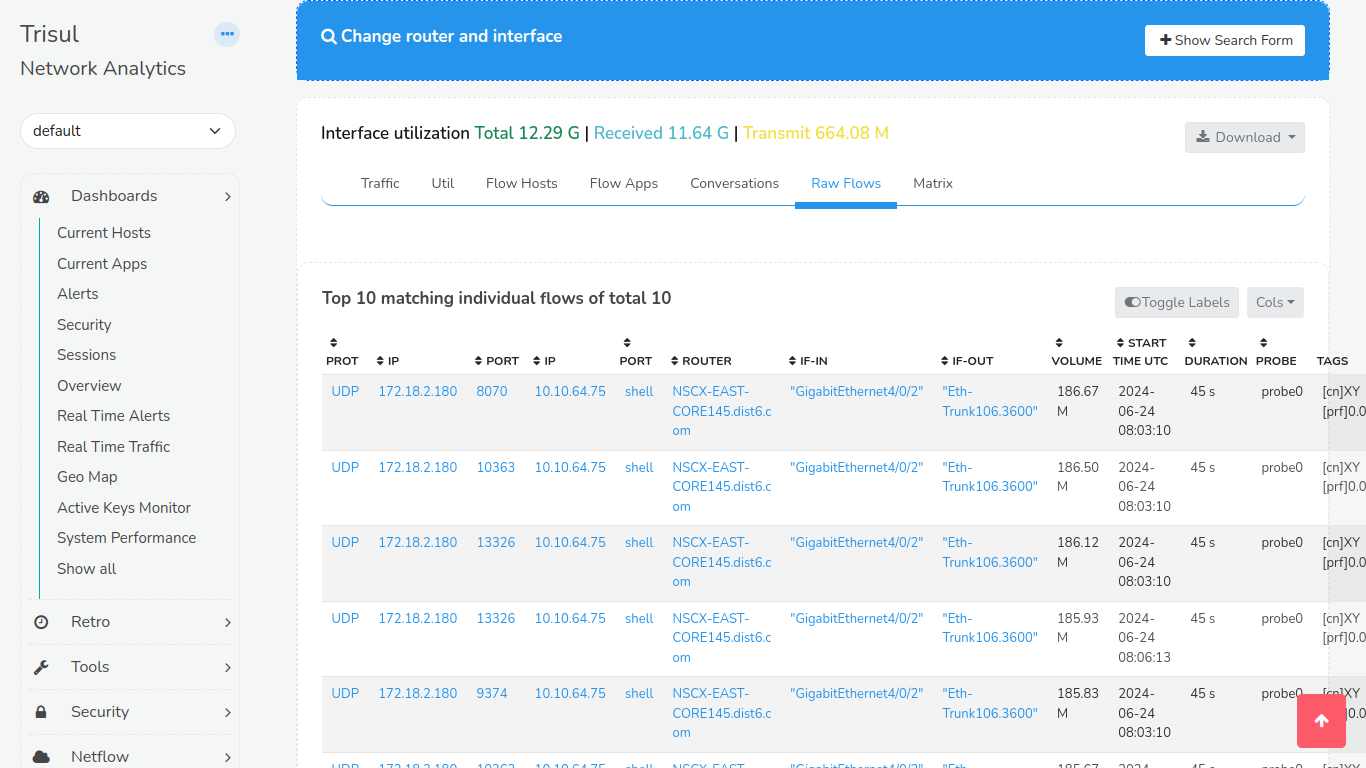
Figure: Raw Flows Tab of Interface Utilization
Interface Traffic Matrix – Chord Diagram
A useful tool that represents traffic flows between interfaces. A chord
diagram looks like the picture below. The interface being drilldown is
represented a chord and the other interfaces are shown as smaller chords
sending or receiving traffic from the subject interface. This is only available after enabling Cross Key 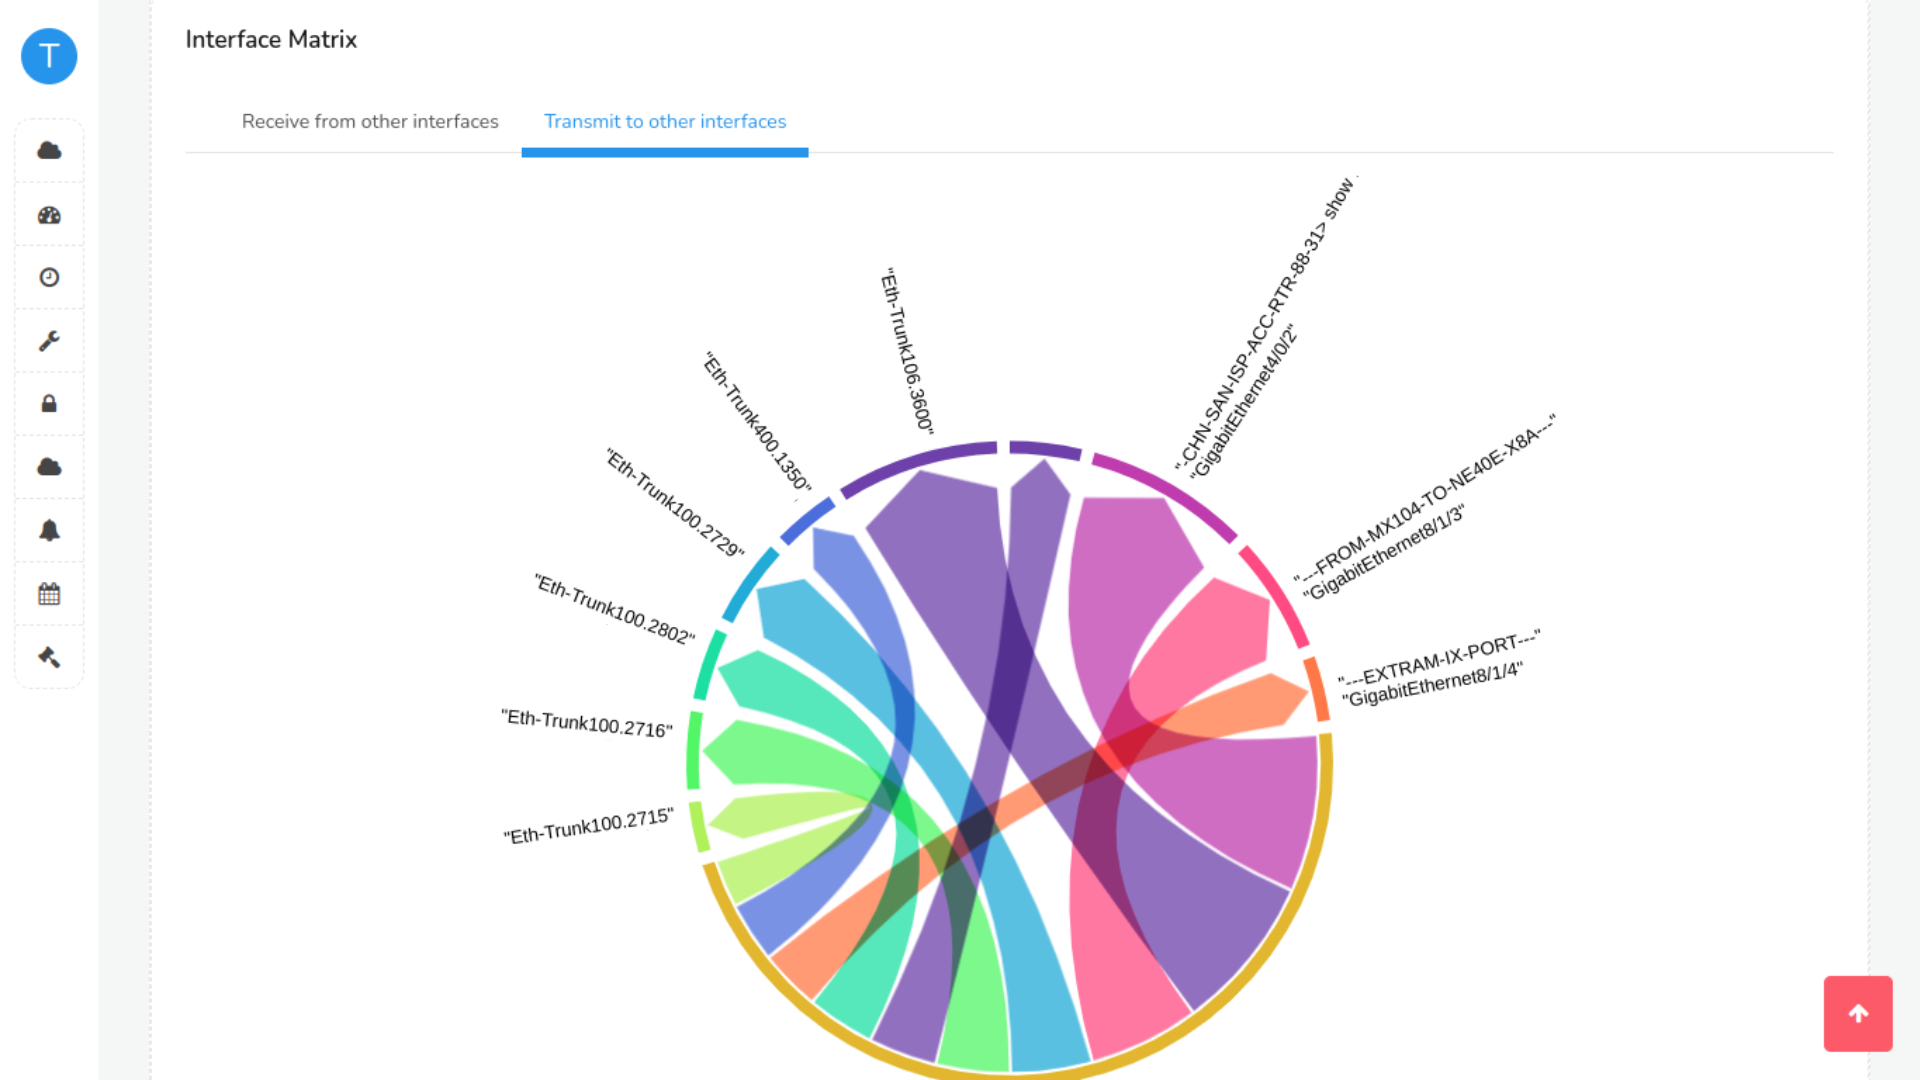
Figure: Interface Traffic Matrix
ASN, NBAR, and Other Details
These are available in the interface drilldowns if the proper trackers are created ahead of time when Cross Key is enabled for them.
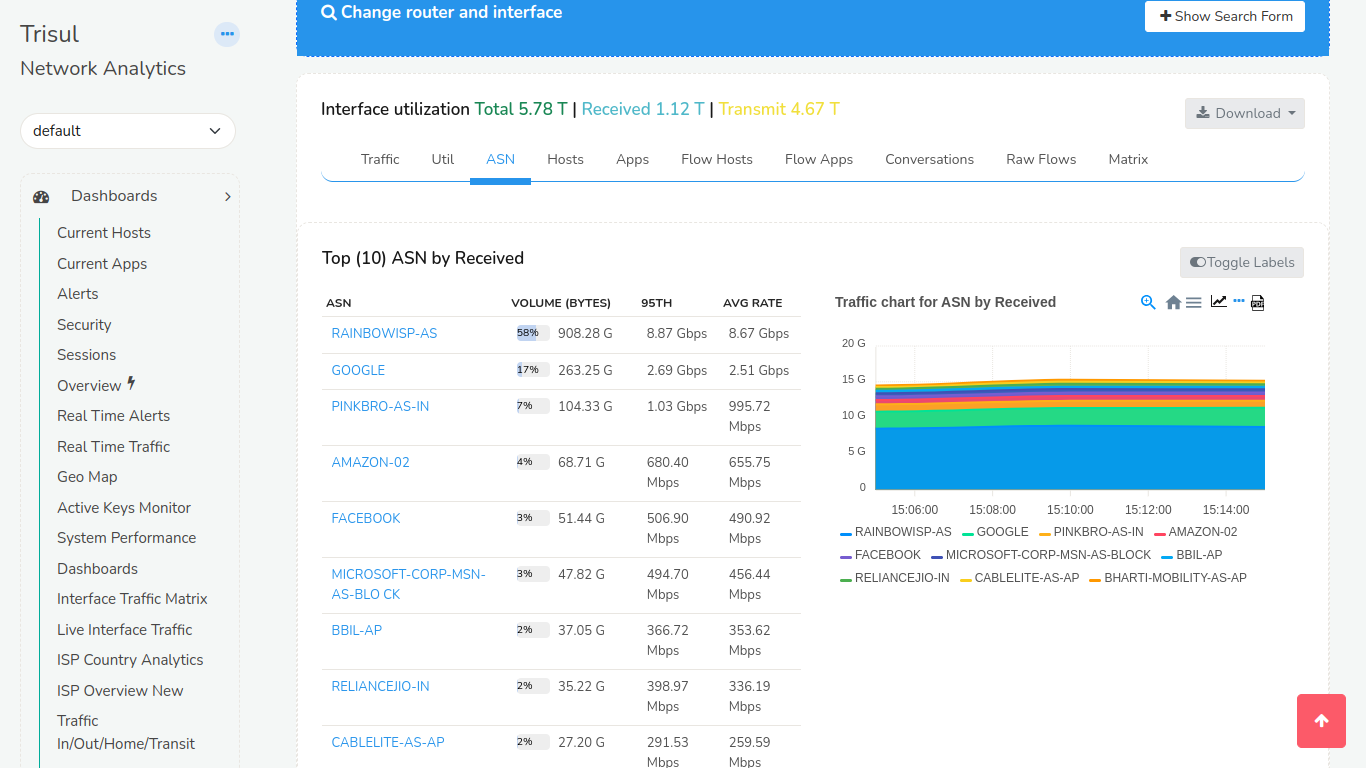
Figure: ASN Tab of Interface Utilization
ASN Details
If you closely observe the chart you may notice that if you sum up the volumes in each of the ASN may be more than the interface volume. This is because for every flow there are TWO AS Numbers. The Source and Destination AS. Hence a 100 GB download from AS-1 will show up as AS-1 100GB Transmit and AS-2 100GB Receive.