NetFlow Sources Dashboard
Overview
This dashboard provides an overview of Netflow data sources, including routers and interfaces. It offers insights into the volume and rate of Netflow data being processed. You can view the system level information on a Time Series chart.
Per Router (Flow Exporter)
- Flow Record Rate: Number of flows per second per router being processed. This indicates the volume of data being sent by each router.
- Flow Sources: Bandwidth usage (in Mbps) per router. This shows the amount of network traffic being monitored by each router.
- Flow Volume: The total Netflow bandwidth (in Mbps) being processed by Trisul. This is an important parameter showing the sum of all flow sources and indicates the overall volume of Netflow data being processed.
Per Interface
- Total Volume: The combined bandwidth usage (in Mbps) of the top 10 interfaces, ranked by their bandwidth usage. This shows the total bandwidth of the most active interfaces.
Using NetFlow Sources
To open the Netflow Sources dashboard, Login as user and,
navigation
👉 Select Netflow → Netflow Sources
Things to try :
- Expand timeframe using the Time Window drop down on the top
- Click on any item inside the chart legend to drilldown into long term views
- Click on Explore (Graph) button on top to add any chart as a Reference chart to others. This allows you to compare different panels.
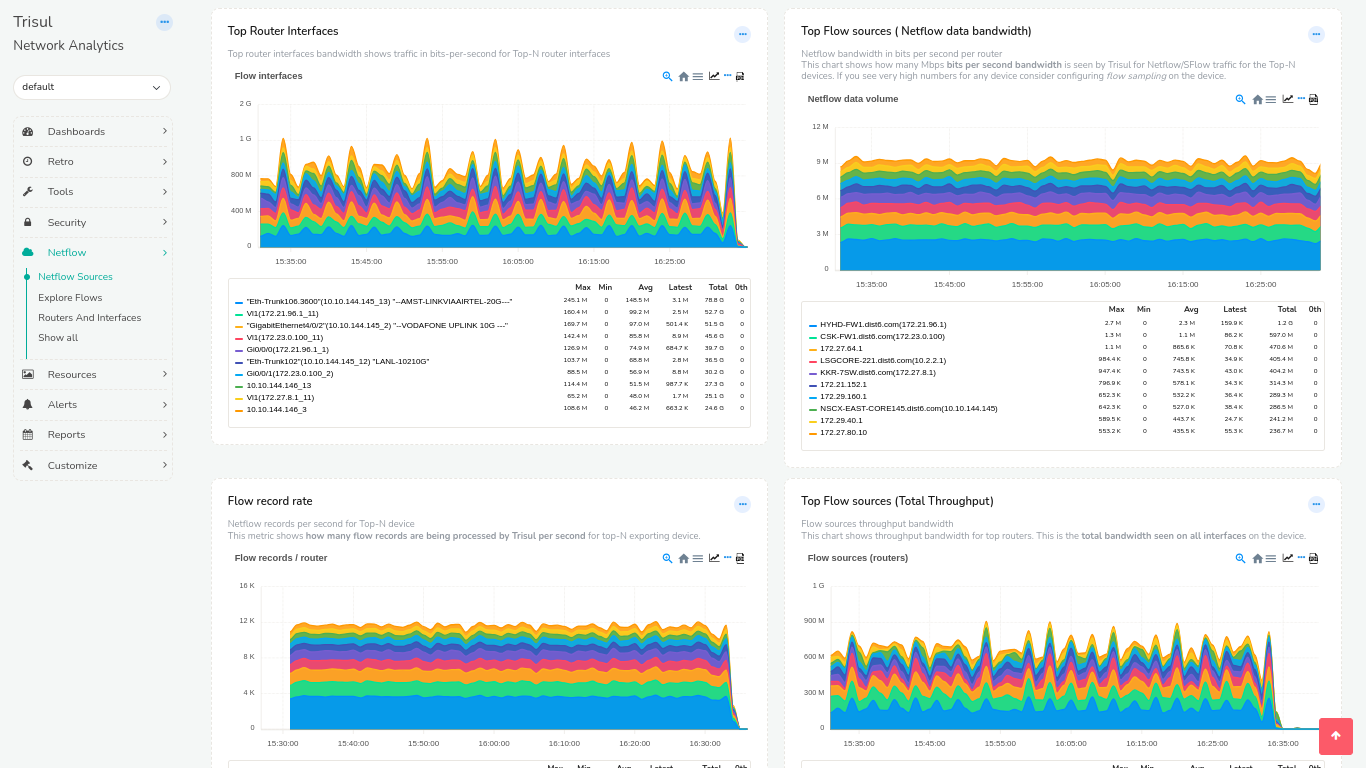
Figure: NetFlow Sources