Trisul with Netflow
This section explains how you can setup Trisul in Netflow mode. In this mode, Trisul uses Netflow and other flow telemetry to drive its analytics engine instead of raw packets. This section describes how to configure Netflow mode, to analyze from a Device perspective, and how to use advanced features such as “Interface Tracking”.
📄️ Configure NetFlow
Trisul has the capability to use NetFlow like telemetry to gain deep
📄️ Routers and Interfaces
The primary tool you will need to work with Device level views of Netflow is the Routers and Interfaces tool. This tool offers network monitoring, enabling you to select a timeframe and view a list of routers with their traffic summaries. From there, you can select a router to view its associated interfaces, and then monitor interface activity or drill down further into hosts, applications, and flows on that interface. You can even pull up a Real Time stabber on any of the drilldowns, providing instant insights into network activity.
📄️ Using SNMP
Trisul can use SNMP to complement Netflow. You can use it to discover device names, interface names, interface speeds, plot real time SNMP traffic charts, etc.
📄️ Interface Tracking
Overview
📄️ Using Packets and Netflow Together
Trisul can also consume a mix of Netflow and raw packets on the same or
📄️ NetFlow Configuration Wizard
NetFlow Configuration Wizard pulls together various configuration options
📄️ Interface Drilldown
Describes the Interface drilldown tool that appears when you select
📄️ Layer 2 and QoS
This section outlines some of the Layer 2 and QoS related features
📄️ Netflow vs SNMP
Trisul has a advanced feature that provides bandwidth mapping of the
📄️ NetFlow Sources Dashboard
Overview
Key Features of Trisul Netflow
Trisul supports Netflow v1, v5, and Netflow v9, Flexible Netflow, and all versions ofSFLOW, and IPFIX. All routers and interfaces are auto discovered.
| Bandwidth and Traffic Monitoring | Flow Analytics for incident response | Security and Anomaly Detection |
|---|---|---|
|
|
|
Introduction to Netflow for Trisul
Netflow is a very handy mechanism to acquire network data from a very large number of network elements in a cost effective manner. For maximum visiblity, we recommend you enable Netflow all over your network and send the logs to a Trisul context.
The following diagram shows an example deployment.
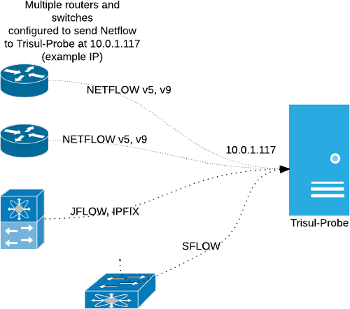
Figure: Configuration of routers/switches to send Netflow (JFLOW,IPFIX,SFlow,etc) to Trisul-Probe
Advantages of Netflow vs Packet Capture
Trisul’s default input mode is raw packet capture. But Trisul also hascomprehensive supportfor Netflow v5/v9/JFlow/IPFIX/and SFlow metering.
| Advantages of netflow input | Disadvantages |
|---|---|
| Easier distributed deployment | No packet based traffic metering like DNS, HTTP, SSL analysis,etc |
| Less expensive hardware | Limited security visibility |
| Scales far better than packets | Cannot access packets for forensics or malware analysis |
Tip: You can use Packet based Trisul to do fullNSM(Network Security Monitoring) at perimeter and Netflow to gain visibilty into lateral traffic inside your network.
Global vs Device View
This may be confusing for those coming to Trisul from traditional netflow solutions. Most of the Trisul dashboards are Global views that represent the sum total of all the interfaces in your network. If you see metrics for 8.8.8.8 it represents the TOTAL traffic to 8.8.8.8 from all the routers in your network.
There is also comprehensive support for a Device View. You access that through the Routers and Interfaces tool. The Device View allows you to select a router then an interface on that router and then see the breakup of traffic within that.
If you log on for the first time into a Netflow instance you may get a dashboard like below. The image below shows where to find the Router and Interfaces for getting to the Device Specific view.
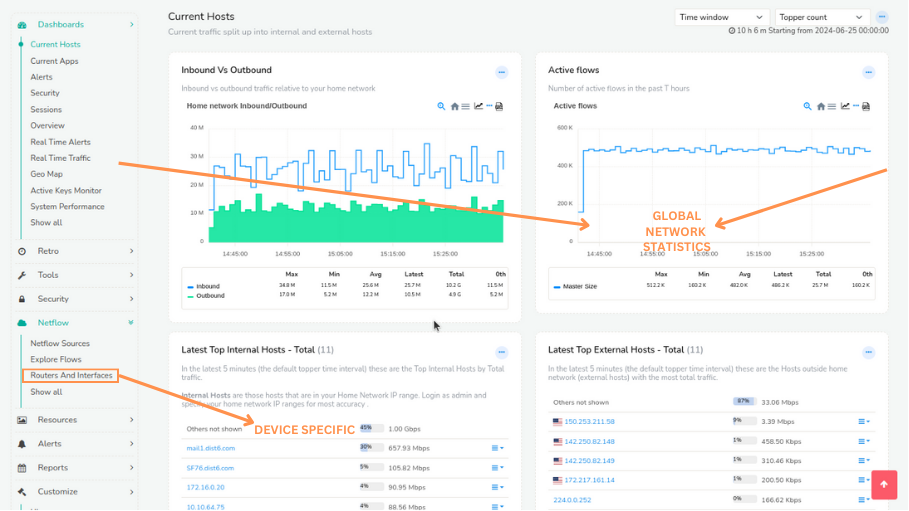
Figure: Global vs Device View
Links
The following docs contain further instructions to setup Netflow
- Setup Netflow— How to switch Trisul into a Netflow mode
- Netflow Configuration Wizard— Using the Netflow Config Wizard to customize, useSNMPto resolve,setup Email alerts, etc
- Routers and Interfaces— The Device Drilldown tool that allows you to select a router, view interfaces, drilldown into an interface
- Using Interface Tracking— EnablingInterface Trackinga feature that allows long term accurate analysis of Hosts, Apps, Protocols into and out of an interface
- Interface Drilldown— Using the Interface Drilldown Screen
- Netflow Sources Dashboard— The netflow sources dashboard
- UsingSNMP— UsingSNMPto complement Netflow device views