DB Status
Overview
At this stage, Trisul is already running and storing data. The DB Status page is used to understand what is being stored, how much, and how it is distributed across the database.
It provides detailed information on Session Flows, Resources, Alerts, FTS (Full Text Search) objects.
Database Segments
Trisul Database is generally divided into three segments based on the how many days Trisul has to store data.
- Oper:
Stores the most recent data. - Reference:
Stores data that has aged beyond the operational window, based on configured retention. - Archive:
Stores older historical data.
You can view how much data is written per day into each segment and use this information to estimate how long data can be retained based on available disk capacity.
To configure the DB storage retention policy refer to Configuring disk storage
You can also view the disk occupied by each counter-group in a SLICE every-day. This is helpful in tuning the system.
👉 Go to Context: Default → Admin Tasks → DB Status
DB Status Dashboard
On the DB Status dashboard, click on the little graph button against each object to view the DB Status trend for that particular object. You can also customize the number of days for which you want to view the trends by clicking on the graph button.
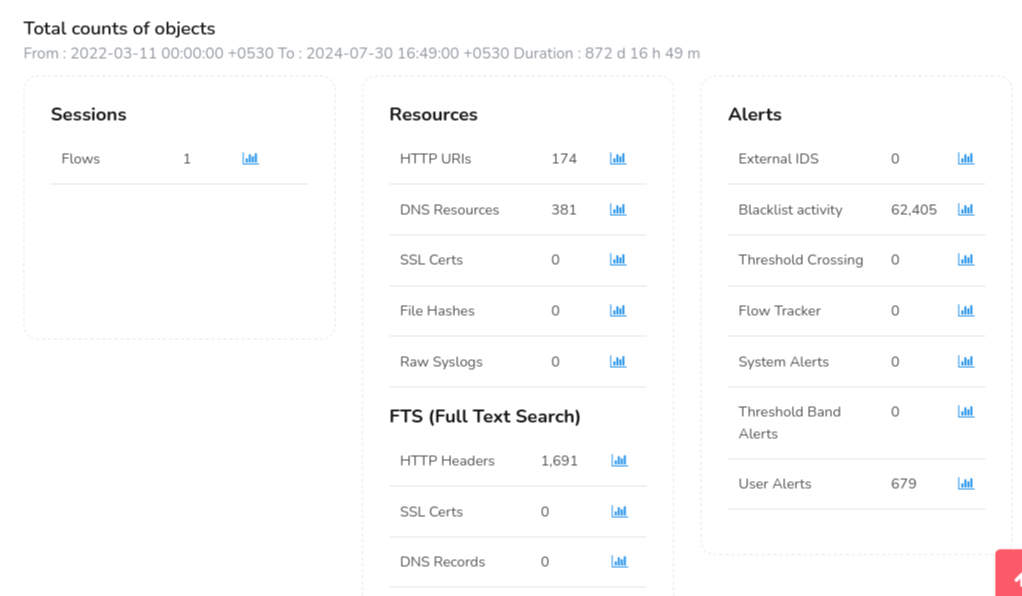
Figure: DB Status Dashboard showing total count of objects
The DB Status dashboard contains several sections, which can be broken down in to:
-
Sessions:
The number of active network flows being tracked by Trisul in real-time. This indicates the current workload and activity level of the network.
- Resources:
-
HTTP URIs: The number of unique HTTP URIs (Uniform Resource Identifiers) tracked by Trisul. This includes URLs, query strings, and other HTTP request metadata.
-
DNS Resources: The number of unique DNS (Domain Name System) resources tracked by Trisul, such as domain names, IP addresses, and DNS query metadata.
-
SSL Certs: The number of unique SSL/TLS certificates tracked by Trisul, including certificate metadata like subject, header etc.
-
File Hashes: The number of unique file hashes tracked by Trisul, which helps identify files and detect potential malware or unauthorized data transfer.
- Alerts:
-
External IDS: The number of alerts generated by external Intrusion Detection Systems (IDS) integrated with Trisul.
-
Blacklist Activity: The number of alerts triggered by activity related to blacklisted IPs, domains, or URLs.
-
Threshold Crossing: The number of alerts generated when predefined thresholds (example, traffic volume, flow rates) are exceeded.
-
Flow Tracker: The number of alerts related to specific flow tracking rules or conditions.
-
System Alerts: The number of alerts generated by Trisul's system monitoring, such as system errors, configuration changes, or resource issues.
-
Threshold Band Alerts: The number of alerts triggered when traffic or flow rates enter a predefined threshold band (example, warning, critical).
-
User Alerts: The number of custom alerts defined by users, such as alerts for specific applications, hosts, or network segments.
- FTS (Full Text Search):
-
HTTP Headers: The number of HTTP headers indexed for full-text search, enabling quick searches for specific header values.
-
SSL Certs: The number of SSL/TLS certificates indexed for full-text search, allowing searches by certificate metadata.
-
DNS Records: The number of DNS records indexed for full-text search, enabling searches by domain, IP, or other DNS metadata.
Database Slices
The Database Slices Dashboard is similar to the one in Storage Status which shows you the overview of the size of all the storage pools used and the total size of the database.
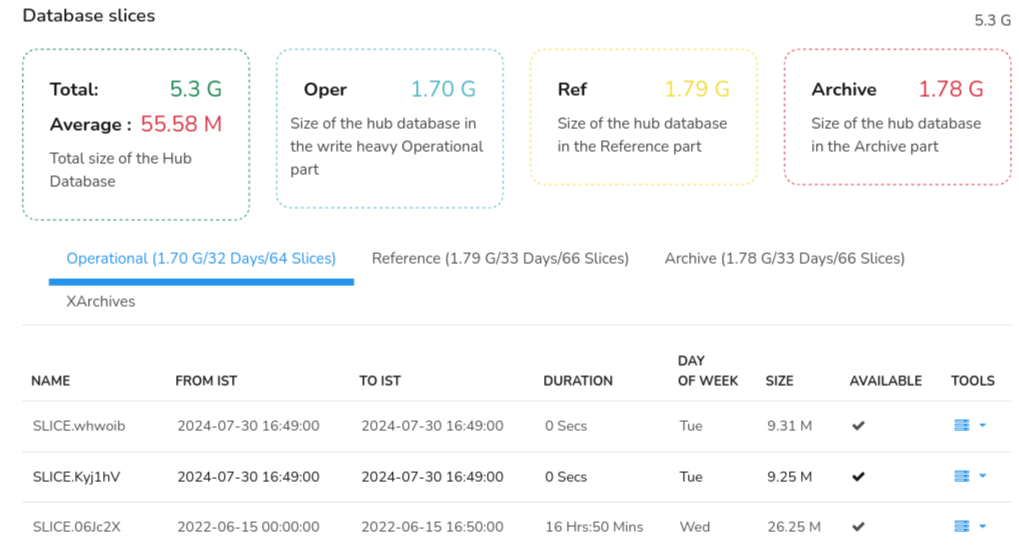
Figure: DB Status dashboard showing Database Slices
Raw Packet Storage Slices
Raw Packet Storage Slices dashboard shows the amount of disk space used to store raw network traffic data in sliced format. Unlike NetFlow, all the raw PCAP slices are stored in Trisul probe.
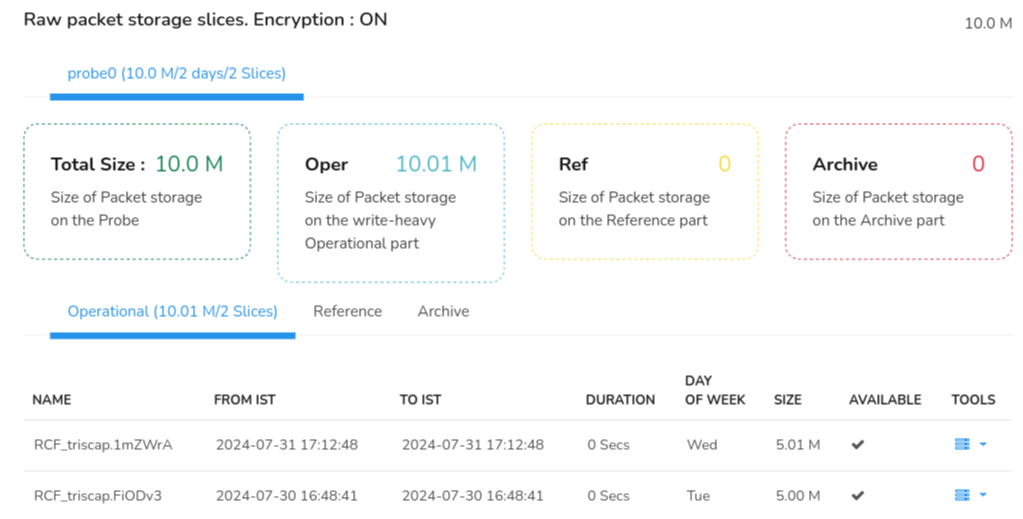 Figure: DB Status dashboard showing raw packet storage slices
It displays the following,
| Information | Description |
|---|---|
| Total Size | The total size of packet storage on the probe |
| Oper | Size of packet storage on the Operational part |
| Ref | Size of the packet storage on the reference part |
| Archive | Size of the packet storage on the archive part |
The PCAP tabular data below the probe slices is similar to the Storage Status tabular data which shows the PCAP information in each storage pools: oper, ref, and archive.