MITRE ATT&CK Alert Timeline
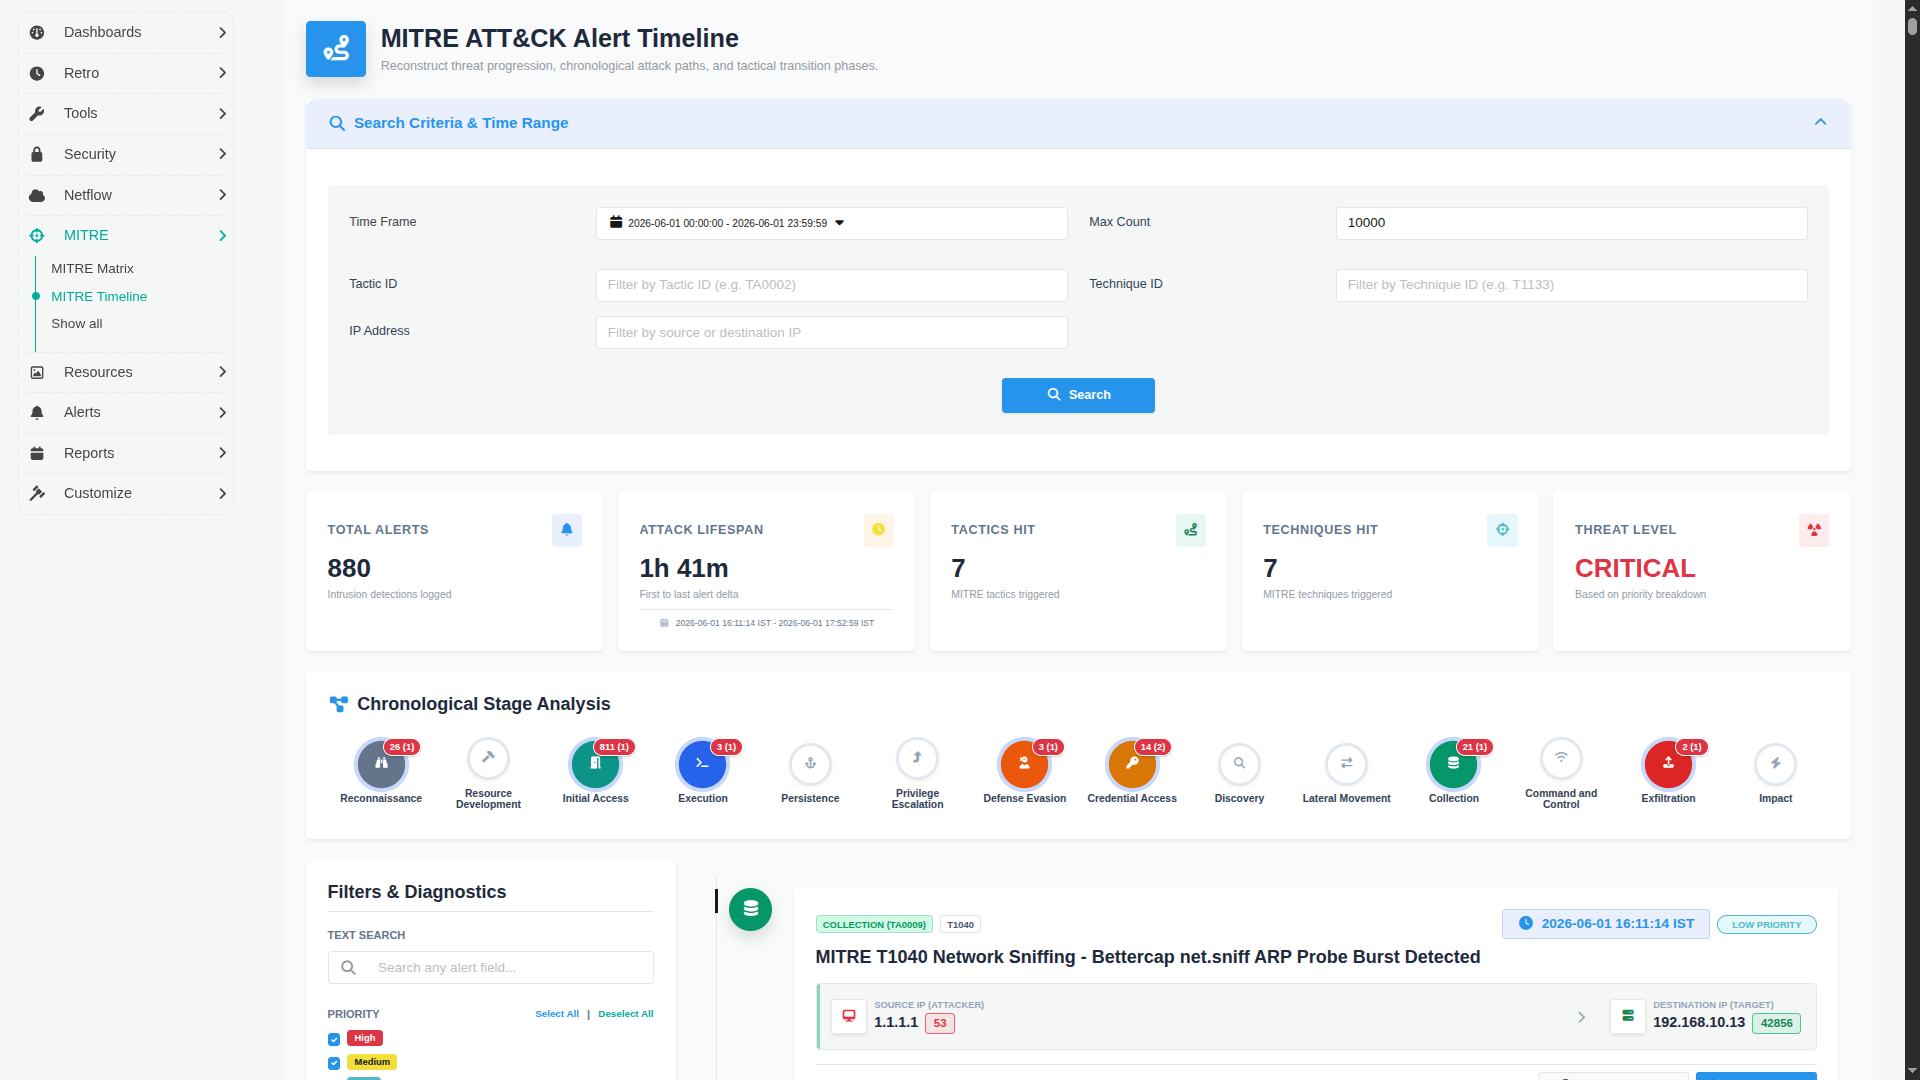
The MITRE ATT&CK Alert Timeline provides a chronological view of intrusion detections mapped to the MITRE ATT&CK framework. It enables analysts to reconstruct the progression of observed attack activity over a selected time period, correlate alerts across MITRE tactics and techniques, and investigate individual detections without leaving the timeline.
The Timeline combines search filters, summary metrics, attack stage visualization, timeline-based alerts, and detailed investigation panels into a single workflow.
Navigation
👉 Go to MITRE from the main sidebar and click MITRE Timeline
This opens the MITRE ATT&CK Timeline dashboard.
Searching the Timeline
Begin an investigation by selecting the required Time Frame.
The Time Frame is mandatory for every search. All remaining search fields are optional.
Available search parameters include:
- Time Frame
- Max Count
- Tactic ID
- Technique ID
- IP Address
When multiple search filters are specified, only alerts matching all selected criteria are returned.
After selecting the required filters, click Search to retrieve matching timeline alerts.
Understanding the Timeline Dashboard
Once the search completes, the dashboard displays a high-level overview of the returned alerts together with their progression across the MITRE ATT&CK framework.
The dashboard contains the following sections:
- Dashboard Summary
- Chronological Stage Analysis
- Filters & Diagnostics
- Timeline Alerts
| Parameter | Section | Description | How to Use |
|---|---|---|---|
| Time Frame | Search Criteria | Selects the investigation time window. | This field is mandatory before running a search. |
| Max Count | Search Criteria | Specifies the maximum number of timeline alerts returned. | Increase the value when investigating larger datasets. |
| Tactic ID | Search Criteria | Filters alerts by MITRE ATT&CK Tactic ID. | Enter a tactic ID such as TA0009. |
| Technique ID | Search Criteria | Filters alerts by MITRE ATT&CK Technique ID. | Enter a technique ID such as T1040. |
| IP Address | Search Criteria | Filters alerts using a source or destination IP address. | Use to investigate activity related to a specific host. |
| Search | Action | Retrieves alerts matching the selected filters. | Click after selecting the required search criteria. |
| Total Alerts | Dashboard Summary | Displays the total number of alerts returned. | Indicates the overall alert volume for the selected search. |
| Attack Lifespan | Dashboard Summary | Displays the duration between the first and last alerts within the selected time frame. | Helps determine how long the observed activity persisted. |
| Tactics Hit | Dashboard Summary | Displays the number of MITRE ATT&CK tactics represented in the returned alerts. | Provides a quick overview of attack progression. |
| Techniques Hit | Dashboard Summary | Displays the number of unique MITRE ATT&CK techniques observed. | Indicates the breadth of attacker behaviour. |
| Threat Level | Dashboard Summary | Displays the overall threat level calculated from the alert priorities and alert count. | Provides a high-level severity assessment for the investigation. |
Chronological Stage Analysis
The Chronological Stage Analysis visualizes the progression of observed activity across the MITRE ATT&CK lifecycle.
Each stage corresponds to a MITRE ATT&CK tactic. The badge displayed on each stage contains:
- Total alerts mapped to that tactic.
- Number of unique technique IDsrepresented by those alerts (shown in brackets).
This provides a quick overview of how the attack progressed through different stages of the ATT&CK framework.
| Parameter | Description | How to Use |
|---|---|---|
| MITRE ATT&CK Stages | Displays the tactics observed during the investigation period. | Review attack progression across the ATT&CK lifecycle. |
| Alert Count | Displays the total number of alerts mapped to each tactic. | Identify the most active attack stages. |
| Unique Techniques | Displays the number of unique techniques for each tactic (shown in brackets). | Helps determine the diversity of activity within a tactic. |
Filters & Diagnostics
The Filters & Diagnostics panel allows analysts to refine the displayed timeline after the initial search.
Available filters include:
- Text Search
- Priority
- Tactics
- Techniques
- Chronological Sort
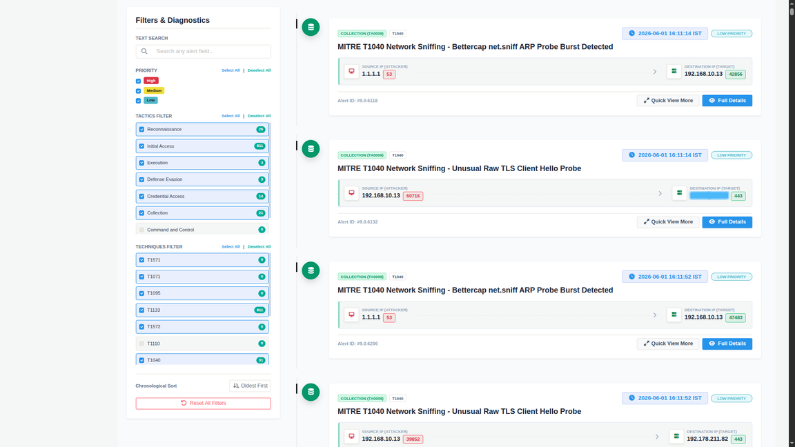
Use Reset All Filters to restore the default filter configuration.
| Parameter | Description | How to Use |
|---|---|---|
| Text Search | Searches across displayed timeline alerts. | Filter alerts using keywords. |
| Priority | Filters alerts by High, Medium, or Low priority. | Select one or more priority levels. |
| Tactics | Filters alerts by MITRE ATT&CK tactic. | Display only alerts mapped to selected tactics. |
| Techniques | Filters alerts by MITRE ATT&CK Technique ID. | Narrow the investigation to selected techniques. |
| Chronological Sort | Changes the order of timeline entries. | Switch between oldest-first and newest-first ordering. |
| Reset All Filters | Clears all applied filters. | Returns the timeline to its default view. |
Investigating Timeline Alerts
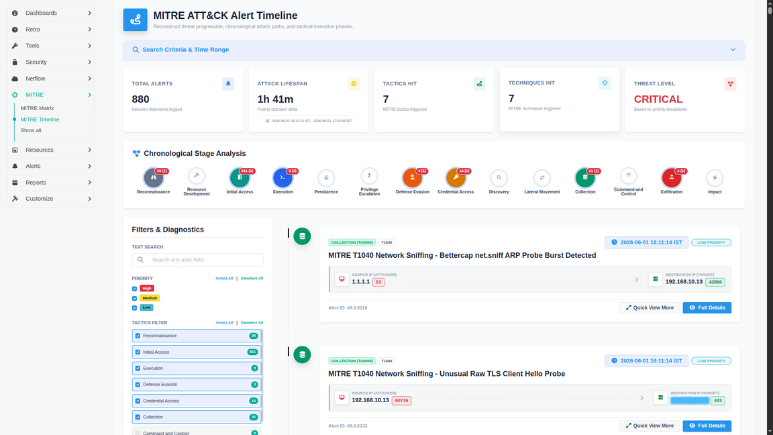
Each matching alert is displayed as a chronological timeline entry.
Every alert card includes:
- MITRE tactic classification
- MITRE Technique ID
- Alert title
- Detection timestamp
- Alert priority
- Source IP and source port
- Destination IP and destination port
- Alert ID
Two investigation options are available for every alert:
- Quick View More
- Full Details
| Parameter | Description | How to Use |
|---|---|---|
| MITRE Tactic | Displays the ATT&CK tactic associated with the alert. | Identify the attack stage. |
| Technique ID | Displays the associated MITRE ATT&CK technique. | Correlate related detections. |
| Alert Title | Displays the alert description. | Understand the detected activity. |
| Priority | Displays the alert priority. | Prioritize investigations. |
| Source IP / Port | Displays the originating host and port. | Identify the communication source. |
| Destination IP / Port | Displays the target host and port. | Identify the affected system or service. |
| Alert ID | Displays the alert identifier. | Reference the detection during investigation. |
| Quick View More | Expands the selected alert within the timeline. | Review additional details without opening the detailed panel. |
| Full Details | Opens the detailed investigation panel. | Access complete alert information. |
Quick View
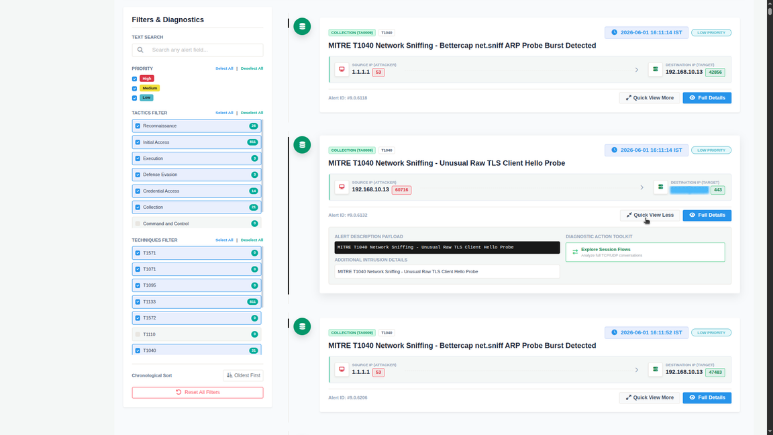
Selecting Quick View More expands only the selected timeline entry and displays additional information without leaving the timeline.
The expanded view includes:
- Alert Description Payload
- Additional Intrusion Details
- Diagnostic Action Toolkit
The Explore Session Flows option opens Explore Flows with the selected source IP and destination IP already populated, allowing analysts to continue investigating the corresponding network communication.
| Parameter | Description | How to Use |
|---|---|---|
| Alert Description Payload | Displays the payload associated with the detection. | Review the generated alert content. |
| Additional Intrusion Details | Displays additional contextual information for the selected alert. | Gather more information before deeper investigation. |
| Diagnostic Action Toolkit | Displays investigation actions available for the alert. | Launch additional investigation tools. |
| Explore Session Flows | Opens Explore Flows using the selected source and destination IP combination. | Continue network-level investigation. |
Full Details
Selecting Full Details opens a detailed investigation panel on the right side of the dashboard.
The panel provides complete information about the selected detection together with links to MITRE ATT&CK references.
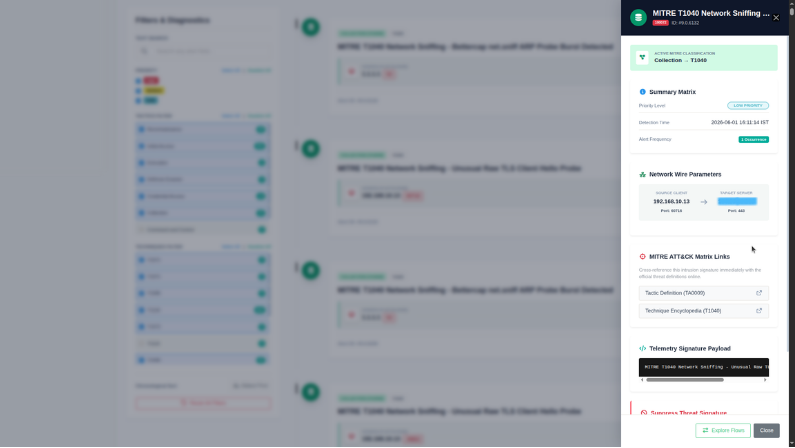
| Parameter | Section | Description | How to Use |
|---|---|---|---|
| Active MITRE Classification | MITRE | Displays the mapped tactic and technique. | Verify the ATT&CK classification. |
| Summary Matrix | Summary | Displays the priority level, detection time, and alert frequency. | Review key alert attributes. |
| Network Wire Parameters | Network | Displays the source client, destination server, and associated ports. | Review the communication involved in the alert. |
| MITRE ATT&CK Matrix Links | References | Provides links to the official MITRE ATT&CK Tactic Definition and Technique Encyclopedia. | Open the corresponding MITRE documentation for additional context. |
| Telemetry Signature Payload | Payload | Displays the telemetry payload associated with the detection. | Review the captured signature payload. |
| Suppress Threat Signature | Suppression | Displays a suppression rule containing the MITRE Technique ID, MITRE Tactic ID, and Signature ID. | Use the generated rule to exclude known or trivial alerts from future detections when required. |
| Explore Flows | Investigation | Opens Explore Flows for the selected source and destination IP communication. | Continue traffic analysis from the selected alert. |
Investigation Workflow
A typical investigation using the MITRE ATT&CK Timeline consists of the following steps:
- Select the required Time Frame.
- Optionally filter by Tactic ID, Technique ID, or IP Address.
- Specify the Max Count and click Search.
- Review the dashboard summary.
- Examine the Chronological Stage Analysis to understand attack progression.
- Refine the displayed alerts using Filters & Diagnostics.
- Expand an alert using Quick View More.
- Open Full Details for complete investigation information.
- Review the associated MITRE ATT&CK references.
- Continue traffic investigation using Explore Flows.
- If required, use the generated suppression rule to exclude known or expected alerts.