Dashboards
In the "Introduction to Dashboards and Modules" section, we’ve already covered what a dashboard is, how to view one, and how to use the dashboard-level menu options.
What You Can Do with Dashboards
This section shows you all the ways you can use and customize dashboards in Trisul. You’ll learn how to switch between different views, add or remove modules, move them around, change what each module shows, create your own dashboards from scratch, and share them with others.
Toggle between views
👉 Go to Dashboard → Show All
Click on the toggle button on the upper right corner to switch between list view and tiles view of the dashboards.
| List view | Tiles view |
|---|---|
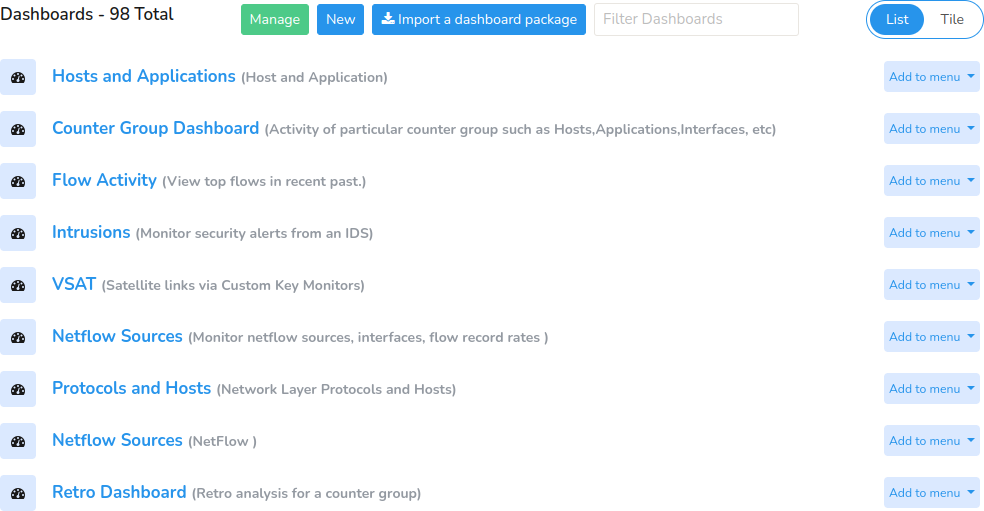 | 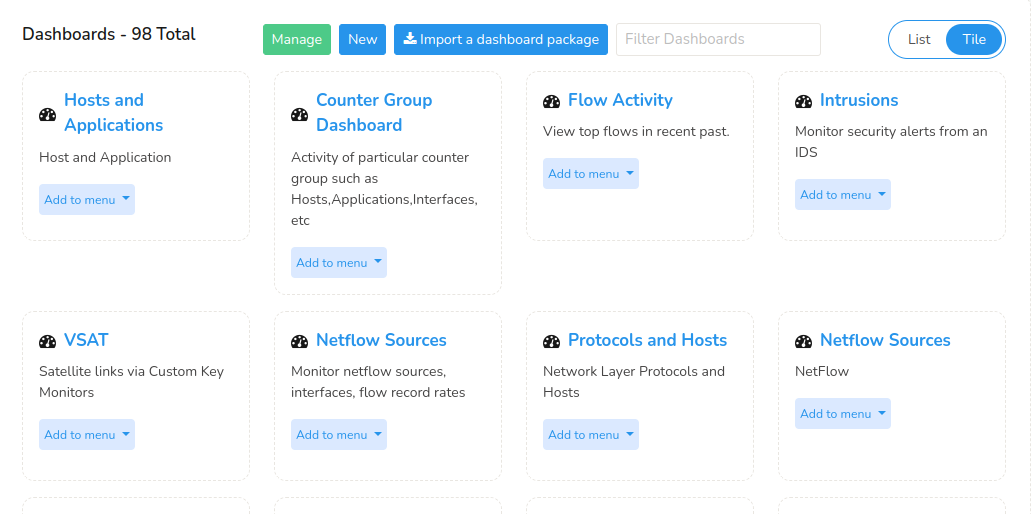 |
| Displays items in a vertical list format for easy scrolling and comparison. | Presents items as clickable tiles for a visually oriented browsing experience. |
Add a Dashboard
To create a dashboard,
👉 Go to Dashboard→ Show all→ New
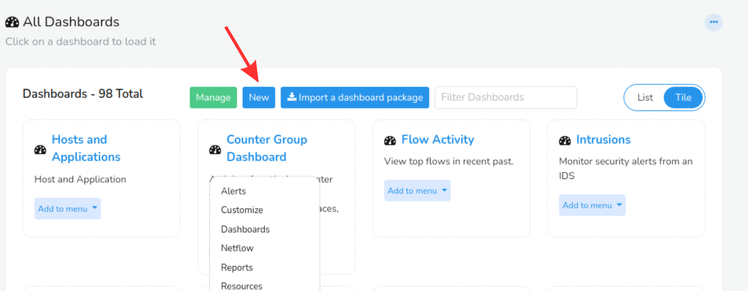
Figure: All Dashboards
Once you click the New button, a Create a new dashboard window opens up (like in the figure below) with the following fields.
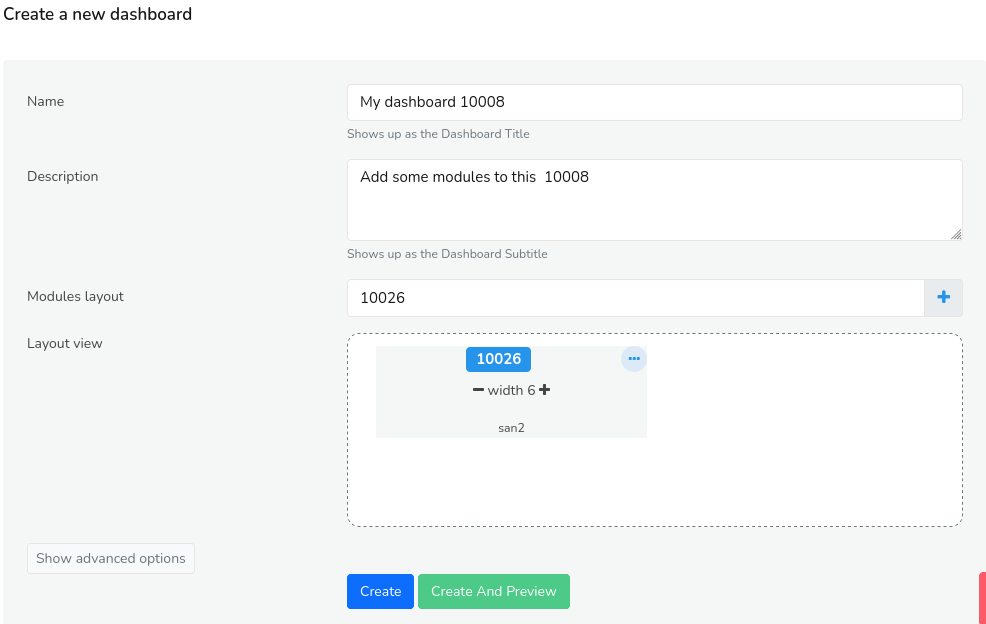
Figure: Customize a Dashboard
| Fields | Description |
|---|---|
| Name | Enter the name of the dashboard |
| Description | Enter a short description of the dashboard |
| Modules Layout | Click on the Plus icon and select from the list of modules you would like to add to this dashboard |
| Layout View | You can view the layout of the added modules as it appears on the dashboard here. You can also rearrange by clicking dragging to the desired position and adjust the width of each modules. |
Once you have filled all the fields, Click Create.
You have now succesfully created a new dashboard!
Advanced Options
To configure advanced settings while creating a dashboard, click the Show Advanced Options button.
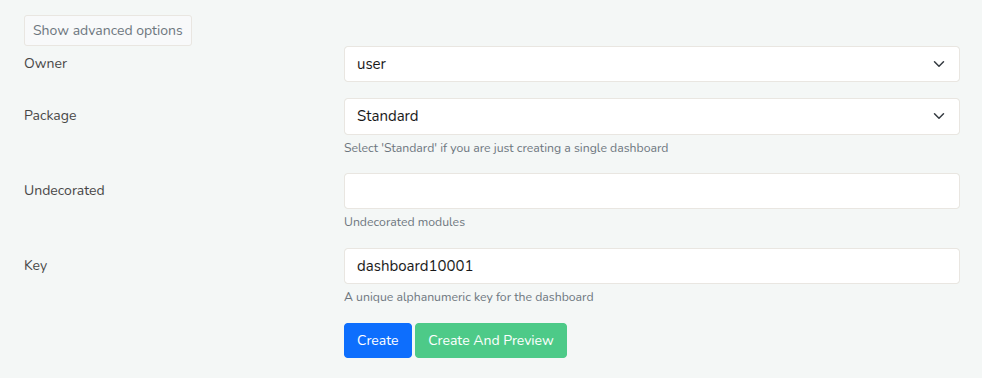
Figure: Showing Advanced Options in Creating a Dashboard
Fill in the following fields to configure the advanced settings.
| Fields | Description |
|---|---|
| Owner | Specifies which user or user group has edit and view privileges for the dashboard. |
| Package | Choose Standard if your dashboard uses built-in features. Choose a Plugin Package if it comes from an added Trisul App. |
| Undecorated | If enabled, displays the dashboard only with data without titles, borders, or other UI elements. |
| Key | A unique identifier used to reference the dashboard programmatically. |
Once you have filled all the fields, Click Create/Create and Preview.
You have now succesfully created a new dashboard with advanced configurations!
Explore a Newly Added Dashboard
Once you create a new dashboard, you’ll be taken to the dashboard panel where your added modules are displayed. Here, you can start viewing and monitoring the metrics for each module. The dashboard shows graphical charts for the selected meters, along with the following elements.
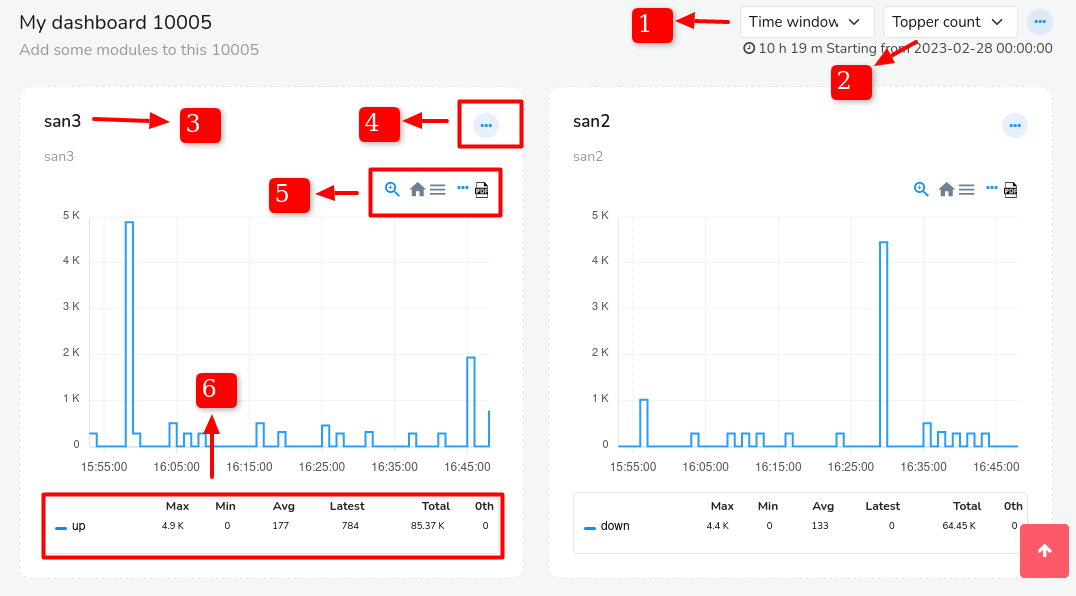
Figure: Dashboard Components
-
Time Selector
You can set the time window for the selected dashboard from 5 mins to any desirable time by choosing a custom time and date.
-
Topper Count
You can choose from 5 to 500 topper counts for the current dashboard.
-
Module Name and Description
Displays the name of the module and a short description
-
Module Toolbar
Displays the description of the module.
-
Chart Interaction Control Icons
The Chart interaction controls are useful in traversing the graphical chart in detail.
-
Legend Table
This table gives you a quick output of values including Max, Min, Avg, Latest, Total and 0th Percentile. If you have added more than one metrics the same will be reflected for each metrics differentiated by color.
How to Add a Dashboard to the Menu
👉 Dashboards→ Show All
Click the Add to Menu button on the dashboard you want to make easily accessible from the main menu.
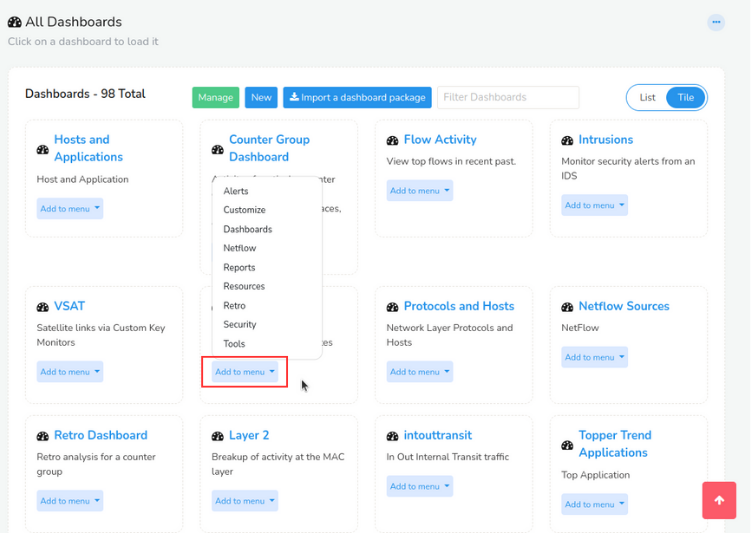
Figure: Add a Dashboard to Menu
That’s it! The dashboard is now part of the main menu, and you can quickly access it anytime with just one click.
How to Remove a Dashboard From the Menu
👉 Go to Customize→ UI→ Menu Manager
There will be a list of all dashboards.
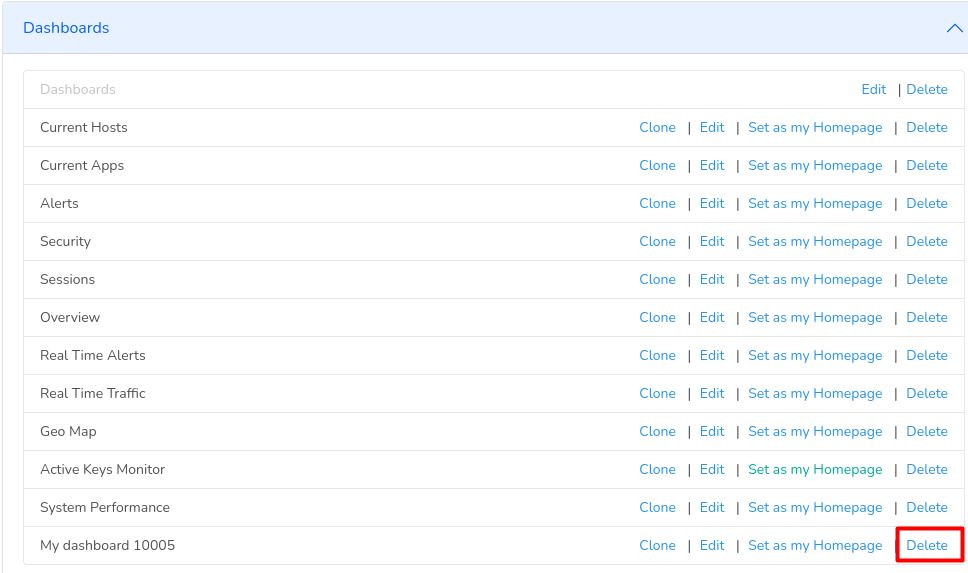
Figure: Remove a Dashboard from the Menu
Find the dashboard you would like to remove from the menu and Click Delete. This will only remove the dashboard from the menu and your dashboard itself will not be deleted.
How to Edit a Dashboard
To edit a Dashboard, from the list of dashboards go to the dashboard you would like to edit. And click on the Dashboard Menu button, the ellipsis icon on the top right corner of the dashboard and click Customize.
How to Export a Dashboard
You can also share the dashboard across different contexts by clicking Export to JSON option.
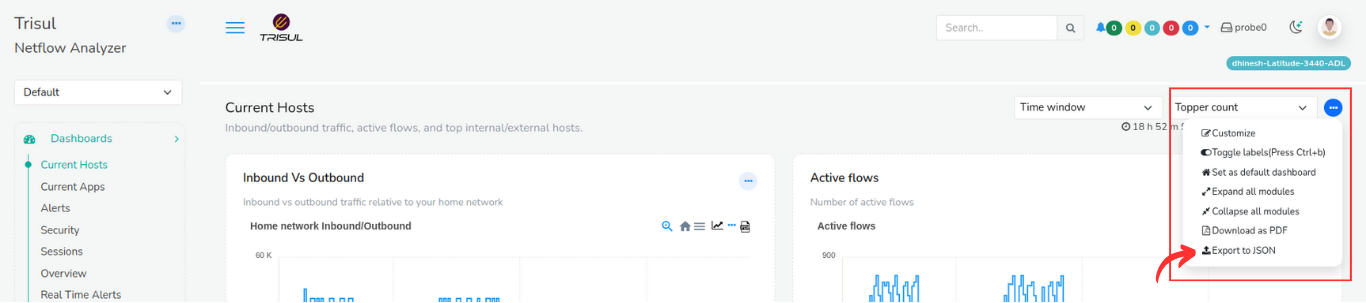
Figure: Export a Dashboard
Click on the Dashboard Menu button, the ellipsis icon on the top right corner on any dashboard and from the dropdown menu click Export to JSON. This will let you download the dashboard in JSON format.
How to Delete/Clone/Export a Dashboard
To delete a dashboard,
👉 Go to Dashboards→ Show all→ Manage
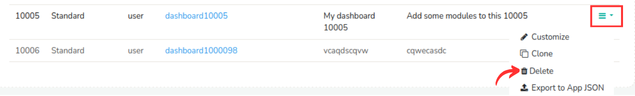
Figure: Delete/Clone/Export a Dashboard
From the list of dashboards, click on the hamburger icon on the right side against the dashboard you would like to delete. and click Delete. Your Dashboard is now deleted.
From the same menu, click Clone in case you need to take a copy of the dashboard before deleting the dashboard.
How to Import a Dashboard
To import a dashboard,
👉 Go to Dashboards→ Show all→ Import a dashboard package
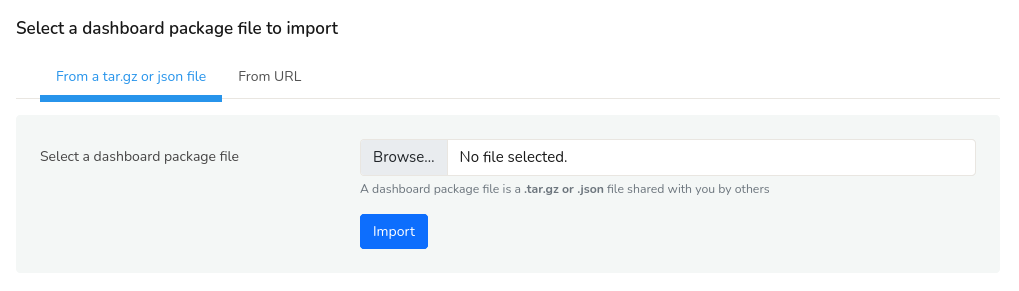
Figure: Import a Dashboard
You can bring in a saved dashboard by importing it as a tar.gz or json file. These files contain the layout, modules, and settings of the dashboard. If you have a link to the dashboard instead of a file, click the From URL tab next to the From a tar.gz or json file to import it directly from the internet.