Web Server Logs
Trisul provides access to various logs through the web interface to facilitate troubleshooting. The following log types are available for monitoring:
| Log Type | Description |
|---|---|
| Web Server Log | Displays logs specific to the Trisul web server. |
| Background Tasks Log | Provides logs for scheduled tasks, including report mailers, blacklist downloaders. You can use this to check status of automatic downloads of threat intelligance, geo, and various other lists. |
| Web Sockets Log | Captures errors related to real-time stabbers. |
| Auth Log | Records user login attempts, including successful and failed logins. |
| Email Log | Displays email logs sent by Trisul. |
| SNMP Dump Log | Allows download of SNMP dumps for advanced debugging purposes. |
Viewing Web Server Logs
👉 Login as admin and select Web Admin → Manage → Web Server Logs
Select the type of log you would like to view from the list of log categories.
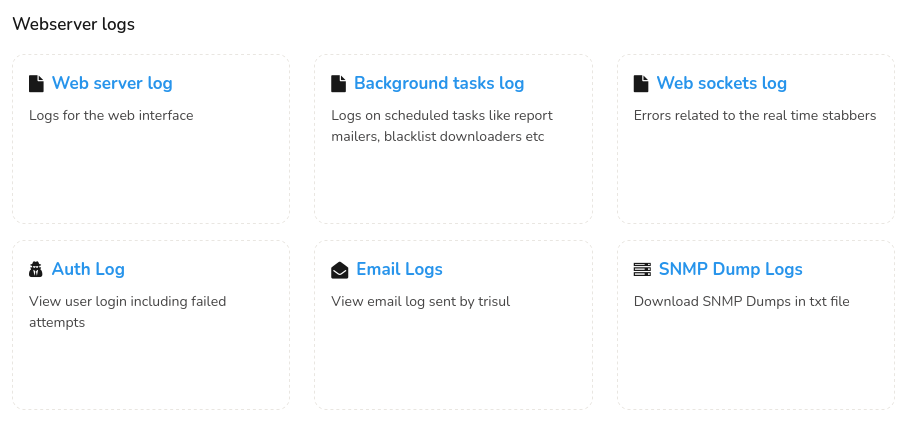
Figure: Web Server Logs
Web Server Log
Click Web Server Log to view the logs as in the figure.
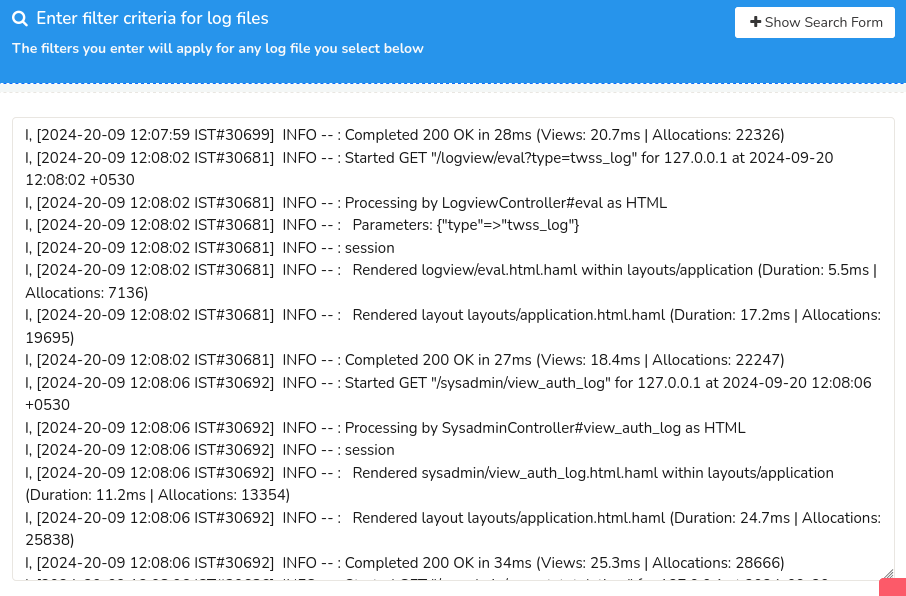
Figure: Web Server Logs
To search for a particular log from the log entries, click on the Show Search Form to open up the search criteria form. Search and locate a particular log by filling in the following fields.
Search Criteria
| Field | Description |
|---|---|
| Show All Messages Above Level | Click on the dropdown to view the list of severity levels including all, fatal, alert, crit, error, warn, notice, info and debug. Select a severity level to display the logs that pertain above the selected level of severity. |
| Number of Lines to Display | Click on the dropdown to select a number to display that many lines on the page. |
| Filter | Enter a string to display the log entries containing that particular string. |
And, Click Search to view the web server log entry.
Background Tasks Log
Click Background Tasks Log to view the background tasks log entries as in the figure.
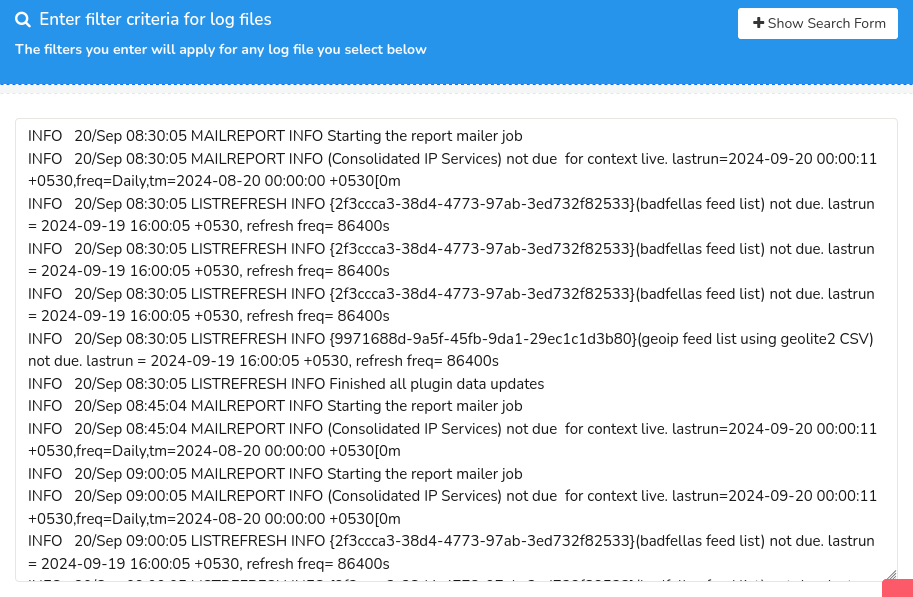
Figure: Background Tasks Log
To search for a particular log from the background tasks log entries, click on the Show Search Form and fill in the search criteria form.
Web Sockets Log
Click Web Sockets Log to view the web socket log entries as in the figure.
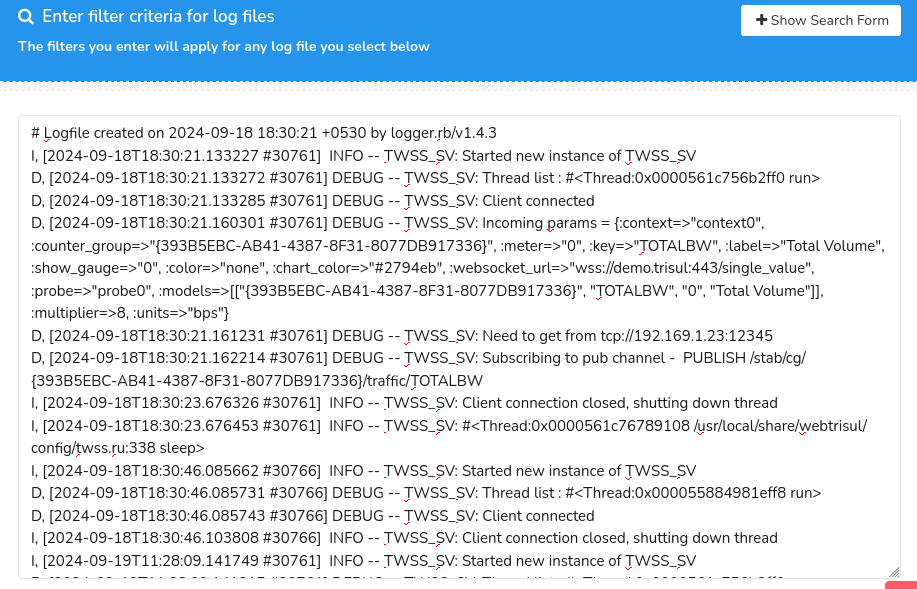
Figure: Web Socket Logs
To search for a particular log from the web socket log entries, click on the Show Search Form and fill in the search criteria form.
Auth Log
See : Auth Log
Email Logs
Click Email Logs to view the email logs sent by Trisul.
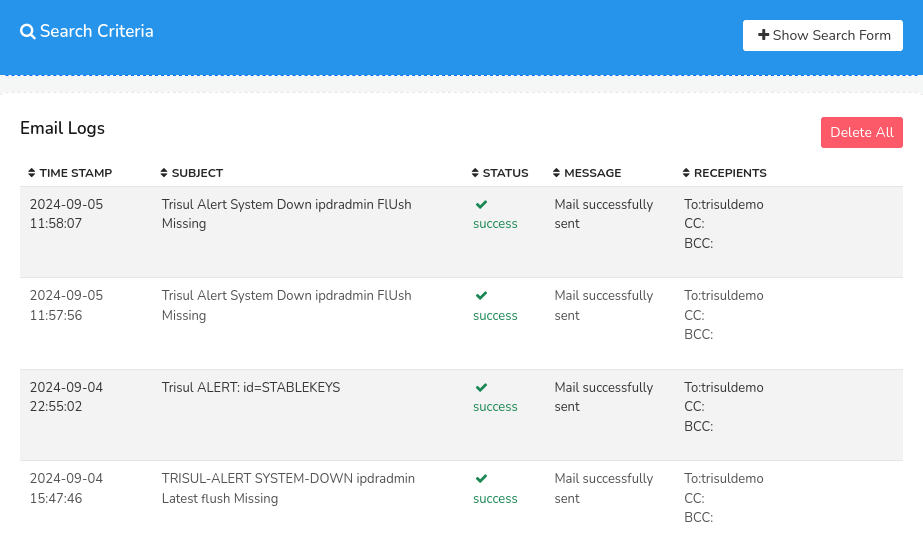
Figure: Email Logs
To search for particular email logs, click on the Show Search Form and select the time range using the Time Selector to narrow down the email log entries in the selected time range.
The email logs contain the following details.
| Column | Description |
|---|---|
| Time Stamp | Displays the date and time when the alert mail has been sent to the recipient. |
| Subject | Contains the subject of the email sent |
| Status | Displays the status of the sent mail to ensure successful alert delivery |
| Message | Shows a short message on the status of the mail delivery with additional context |
| Recipients | Displays a list of recipients who received emails sent by Trisul. |
SNMP Dump Logs
You can simply click on the SNMP Dump Logs button to download the SNMP dumps as a text file.
Viewing Probe and Hub Logs
Hub and Probe logs represent the actual Trisul processes running processing network traffic. They are linked to a particular context. To view Hub and Probe logs
👉 Login as admin and select Context: default → Admin Tasks → Start/Stop Tasks
This shows the list of hubs and probes. To view Hub and Probe logs click on the More Options link and select the view options link as shown below.
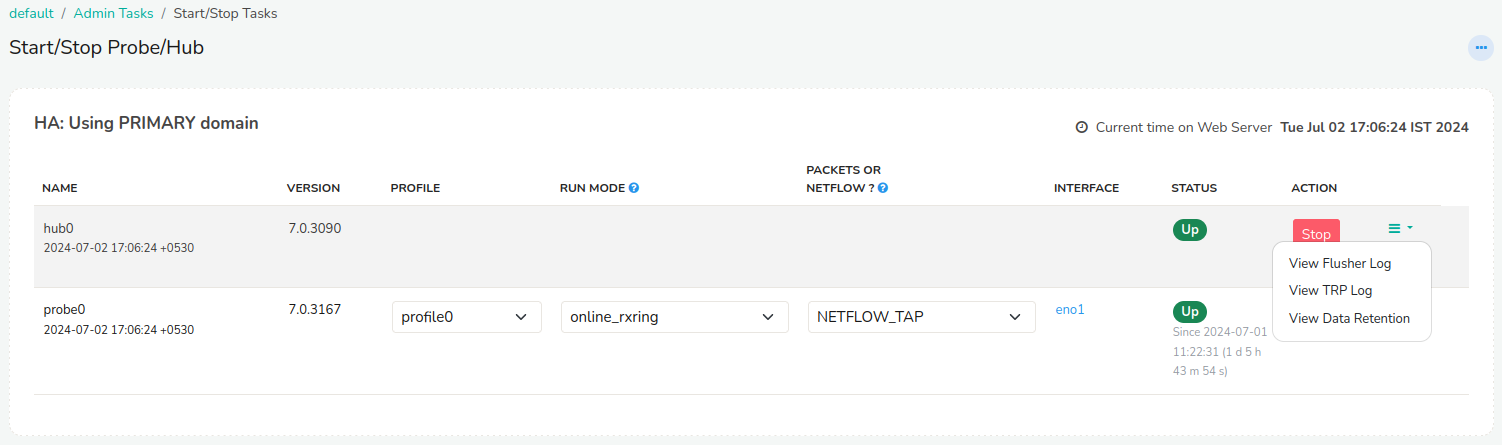
Figure: View Options in Hubs and Probes
Log Directory
If you want the raw webserver log it can be found on the Trisul Hub
server at /usr/local/var/log/trisul-hub/webtrisul
The files are named production.log or productionssl.log (if you are
running webtrisul on HTTPS)
Also see trisbashrc:“/docs/ref/trisbashrc.html which contains helper
aliases to locate various log files on the probe and hub server systems.