Context Menus
A Trisul context is a separate instance of Trisul with its own isolated database, configuration, and processes. To know more about contexts, Refer to Working with Contexts
Admin Tasks
All the administrative functions are being done here right from starting/stopping Hub and Probe nodes to monitoring Netflow and BGP in Trisul.

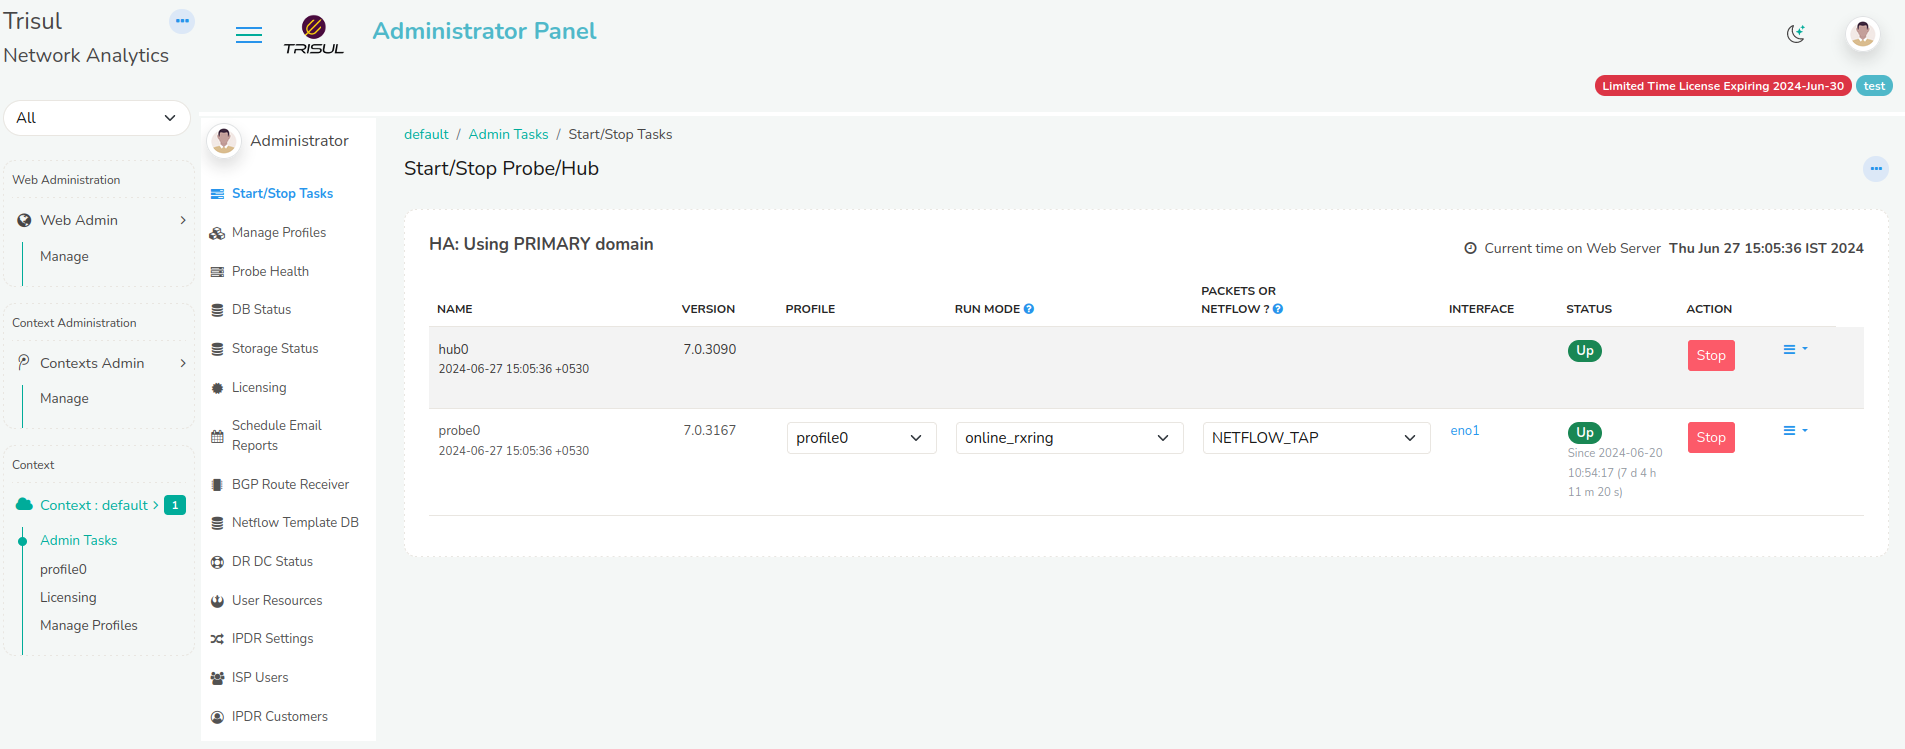
Figure: Start/Stop Tasks in Admin Panel
Start/Stop Tasks
This Menu is generally used to start/stop Hub and Probe nodes associated with each context. Each context will have separate Hub and Probe nodes. You can directly start and stop the nodes from Web Interface through this menu.
Manage Profiles
This menu provides a list of available profiles used by multiple probes. Profile assigned to probes cannot be deleted. If multiple probes are setup, Multiple profiles will be created automatically and listed here.
To create a new profile, select Create Profile option.
You are shown the form with following fields
| Field Name | Description |
|---|---|
| Profile Name | Name for the profile. Name should be alpha numeric and length should not exceed 10 characters |
| Profile Description | Describes the function of the profile created |
| Clone from Context | You can choose between multiple context to clone profile |
| Clone from Profile | You can also clone an entire profile from a list of profiles |
Probe Health
This menu is nothing but a Probe Health Monitor. It shows the reachability, current traffic, and latency of Trisul Probes in this particulat context.
It shows the count for Total No.of Probes, No.of Unreachable Probes, No.of Probes Up/Down. Also provides the Latest Bandwidth in Gbps for each probe.
DB Status
This menu shows up the Trisul Data Store Statistics. It provides detailed information on Session Flows, Resources, Alerts, FTS (Full Text Search) objects.
Trisul Database is generally divided into three segments based on the how many days Trisul has to store data.
- Oper is where the Latest data gets stored.
- Reference is the next level where data is pushed based on the days specified for storage.
- Archive is responsible for storing very old data.
You can view how much volume of data is being stored per day in each slice and you can calculate accordingly as to how much days data can be stored depending on the size of the disk.
To configure the DB storage retention policy refer to Configuring disk storage
You can also view the disk occupied by each counter-group in a SLICE every-day. This is helpful in tuning the system.
Licensing
This menu gets you through the license policy of Trisul.
Trisul Network Analytics licenses are :
- Perpetual
- Need one license per physical node
- Tied to a machine ID
License types are :
- Free 3-Day License : this is the default license that does not expire but only gives you a 3-day window of history
- Production License : depends on the number of active internal
endpoints in your Home Network space
- Small Business : 500 simultaneously active Internal IPs
- Medium : 3000 simultaneously active Internal IPs
- Unlimited : As many as your hardware can support
To Install a new License, Refer to the Installing Trisul License for instructions
Schedule Email Reports
You can Schedule Automatic Reports from Trisul like PDF Reports, Alert based Reports etc.
You may dispatch by email any of the supported report types at these intervals.
- Hourly
- Daily
- Weekly
- Monthly
To know more about how to schedule Reports, Refer to Schedule Reports
BGP Route Reciever
This menu is all about the status of BGP Route Reciever. It shows the BGP Status on all probes.
To start the BGP Receiver you need root privileges on the probe, then type systemctl start trisul-bgp
To know more on Trisul-BGP concept, See Trisul-BGP
Netflow Template DB
Netflow v9, IPFIX, JFlow, Netstream are technologies that use a concept of Template records. These are special records sent by the router which describe the metrics contained in normal data flow records. Viewing these template records are a great way to troubleshoot Netflow.
This Menu provides Netflow/IPFIX template database received by all probes.
You can see the template database on each probe. This is updated every 10 minutes or when a new template is received.
DR DC Status
Trisul supports Diaster Recovery when the Primary Site crashes.
The Primary Site is the Data Centre where Traffic is pushed. With the DR Setup, Trisul also creates a backup of all the traffic in the DR site and once the Primary site is down, the DR site is up.
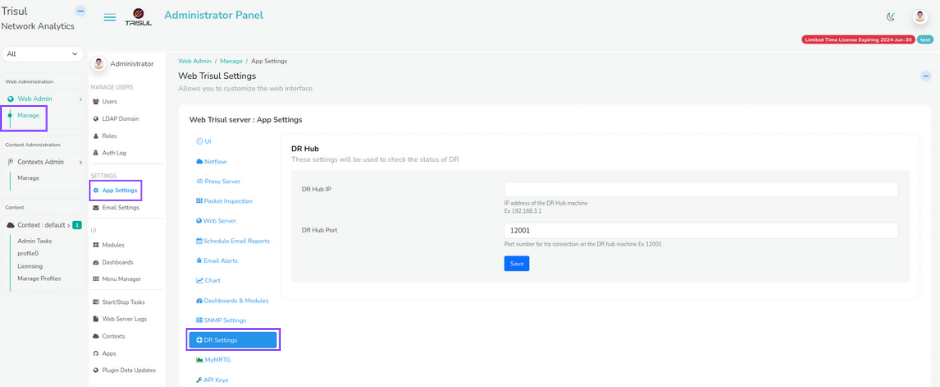
We can configure the Primary site in such a way that we can check if the DR site is running.
👉 Login as User. Select Manage → App Settings → DR Settings.
Enter the IP and TCP Port number of the DR Site.

Figure: DR Settings
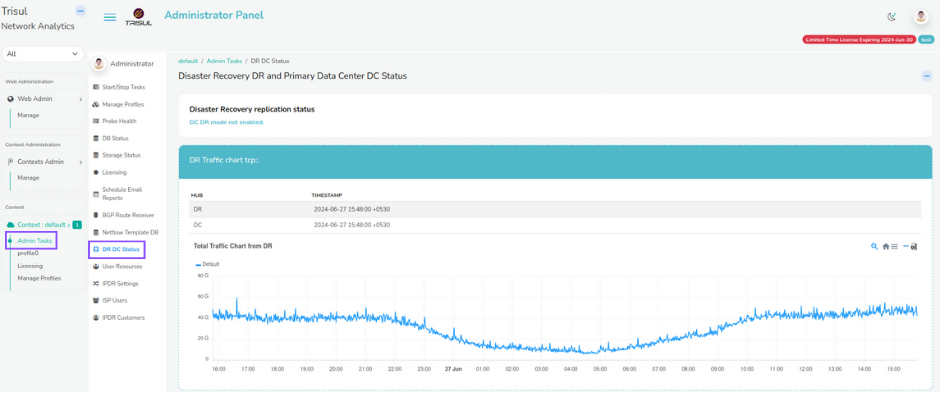
By Configuring the DR Settings,you can view the Traffic Chart and DB Status of the DR Site from the primary site.

Figure: DR Traffic Chart
Refer Disaster Recovery
Profile Menu
The Profile Menu has all the basic configuration related traffic monitoring, flows, custom counters, Alerts, Resources and Advanced Tools that can be modified as and when it is needed. The default profile is called profile0 you can click on that item to access the profile menu.

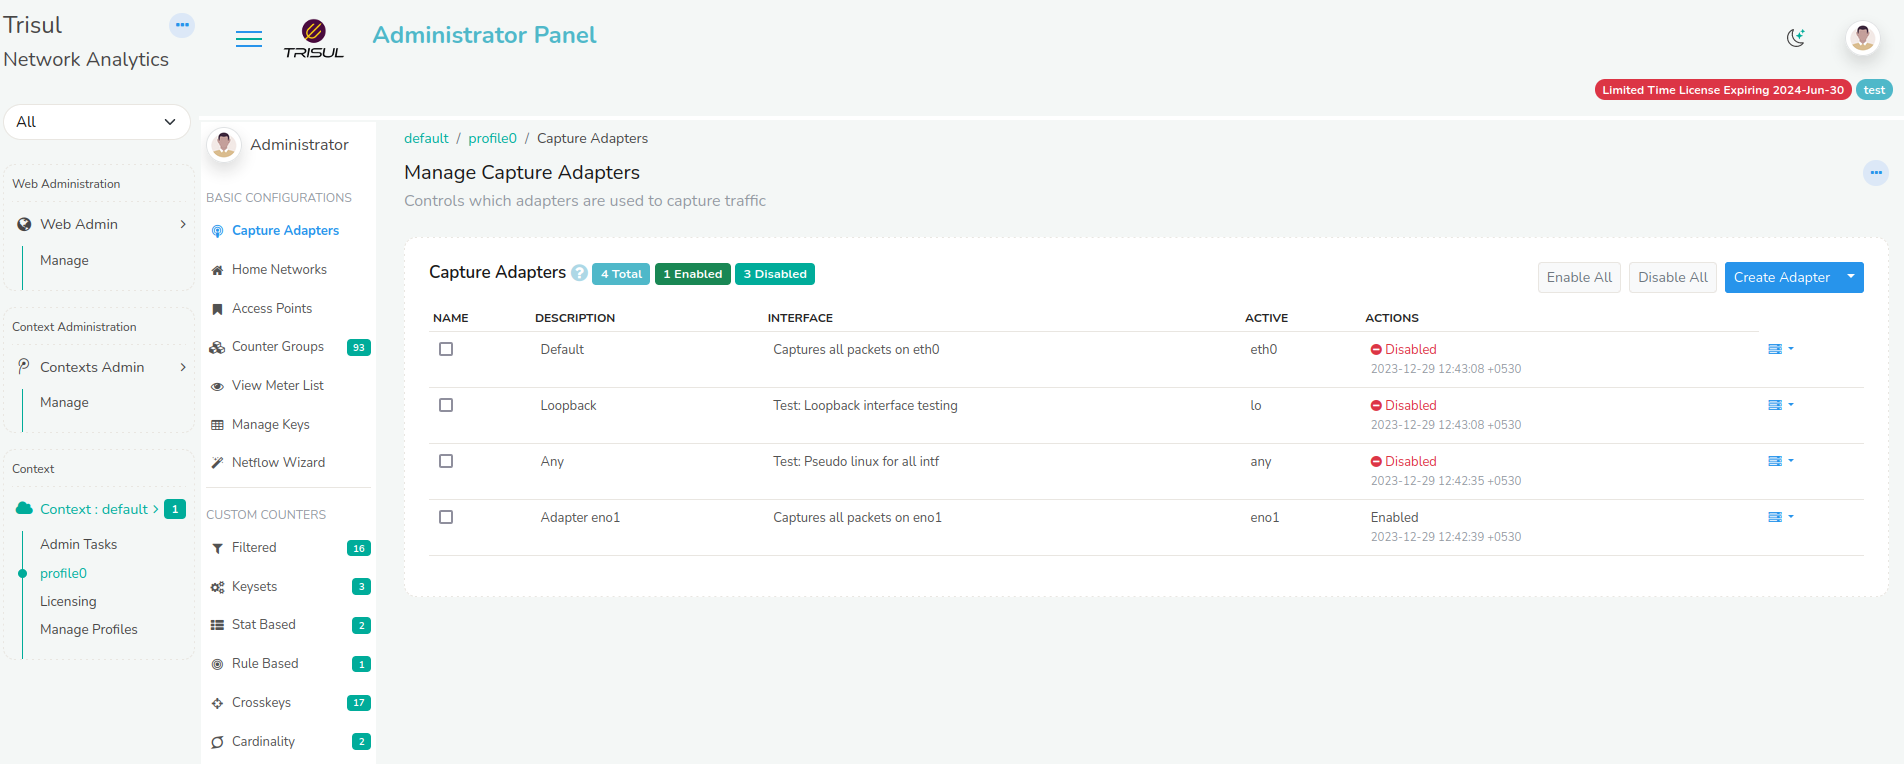
Figure: Profile0 in Context: default
Capture Adapters
Trisul has the capability to listen to the netflow traffic from the network interface or adapters that we specify.
This menu helps you to configure the adapter to which you want Trisul to listen to.
For more about selecting a capture adapter or interface
Home Networks
Home networks are used to differentiate internal and external traffic. If you need to monitor a range of internal IPs within your organisation you can type the IP along with the subnets.
To create a home network, Go to Home networks-> Select Add
You are shown the form with following fields
| Field Name | Description |
|---|---|
| Network Number | Enter a network number : Example 19.28.182.0 or Enter a newtork number with CIDR : Example 192.168.182.0/24 |
| Network Mask | Enter a subnet mask : Example 255.255.255.0 |
Refer to Home Networks
Click on Create to add a new home network
Access Points
They Control how protocols are mapped to ports and other entities. Access points map protocols to ports. For example if you want to decode UDP port 5556 as Netflow you can edit UDP then map Port 5556 to the Netflow protocol.
Refer to Access Points
Counter Groups
Trisul ships with 40-50 counter groups. Often users want some special type of metering for their environment. Trisul lets you build your own advanced traffic metering on top of the existing counter groups.
This menu controls how various counter groups are processed by Trisul. It provides a list of available counter groups with Name,Description,Type, Bucketsize, HiWater, etc.
You can manually edit the parameters in counter groups by selecting edit option.
Refer to Trisul Counter Groups
View Meters
This menu describes all the meters available out of the box in Trisul. Installing additional plugins will usually give you even more meters which will be described in detail by the documentation accompanying each plugin.
It provides the Detailed metrics of each counter group like Total, In, Out, BucketSize, TopperBucketsize, GUID, etc
Refer to Trisul Traffic Meters
NetFlow Wizard
This menu allows you to configure Netflow.
- You can mention the ports you want trisul to listen on Netflow.
- You can Select the network adapter on which netflow traffic occurs.
- You can Select the counter groups typically used in Netflow Environments.
- You set the Netflow ports i.e the access points for netflow traffic.
- You can configure your routers and interfaces and also resolve your IPs from here.
Refer to Netflow Wizard
Filtered Counter
It is a cross-product counter group.
Meter a subset of a group that matches a set of keys from another group.
Filtered counter group are invaluable in setting up cross-group counters.
Refer to Filtered Counter
Keysets
A new counter group that aggregates sets of keys from a host counter group. Essentially monitors a “group of keys” as a single key.
To create a Keyset counter group, Refer to Keyset Counter
Stat Based
A new counter group consisting of items based on an observed meter value.
Creates a subset of a parent group consisting only of items who meet a certain meter criteria.
Refer to Stat Based Counter
Rule Based
A rule based counter group allows you the maximum flexibility to custom-meter your network traffic.
It works like this :
# Derive from a parent group such as hosts / applications / macs
# Specify a chain of rules in Trisul Filter Format
# The first rule that matches determines the meter key
# If no rule matches the key falls through to the parent counter group
Refer to Rule Based Counter
Crosskeys
This lets you monitor a cross product of two or three counter groups. By crossing the Applications X Hosts counter group you setup a new counter group with Hosts-App keys this lets you monitor traffic statistics for Hosts-App flows.
Refer to Crosskey Counter
Cardinality
Cardinality counters allow you to measure unique hits for keys within a counter group. For example, we can track how many unique IPs did each country see.
You may add your own cardinality counters to any counter group with the following restriction :
- A maximum of 2 cardinality counters are allowed per counter group.
Refer to Cardinality Counter
Session Groups
Flows such as TCP/UDP connections are known as sessions. This menu shows information about Session groups like Name, Description, TimeOutSecs, Volume bytes Cut off, Active Tracking, Status
Flow Trackers
A flow tracker is used to capture and save snapshots of top flows matching a range of criteria.
The Trisul database can potentially end up with hundreds of millions of flows every day. Using flow trackers you can perform quick topper analysis of the flow database over large timeframes.
A common use case of Flow Trackers is to track the so called ‘Elephant flows’. Those are flows transferring a huge volume of data. But as you shall see below this is not the only type of tracker. Flow trackers are also necessary for you to use flow tracker alerts.
Refer to Flow Tracker
Flow Tagger
Flow Taggers assign one or more text labels to flows in real time. These labels are created by rules you specify. You can then search for flows containing these text tags.
Some examples
- Mark flows that generated an alert with the tag
"ALRT" - Mark flows to China or Ukraine as
"CHUKR" - Mark all non-HTTP flows to your subnet 10.18.10.0/24 as
"SUSPECT"
Refer to Flow Tagger
Alert Groups
An “Alert Group” represents a type of alert. Trisul ships with 6 Alert groups
- Threshold Crossing Alerts : Based on a meter value exceeding fixed Hi and Lo water marks for a certain time
- Flow Tracking Alerts : Anomalous flow behaviour you define
- IDS Alerts : When interfacing with external IDS systems like Suricata
- Blacklist : When triggered by blacklisted indicators
- Threshold Band Alerts : When a meter value drifts outside a “trained” band of normal values
- System Alerts : From Trisul self monitoring, packet drops, memory pressure etc.
You can create your own alert types using the alertgroup LUA API Alert groups you create using the LUA API will also show up in Trisul and be managed along with the built in alert groups.
Refer All Alert Groups
Flow Tracker Alert
Trisul provides a powerful way to generate an alert when certain types of flow activity occurs. Also see Flow Trackers for instructions on using Flow Trackers which is a pre-requisite to creating Flow Tracker Alerts (this section).
The alerts
- show up on the Web Interface alert tracker (top right)
- can be sent in near real time (1-5 sec) via email or Text Message (SMS)
Refer Flow Tracker Alert for Instructions.
Threshold Crossing
You can assign thresholds to any meter value. Trisul continuously monitors the value of the traffic meter against the configured thresholds and generates a “Threshold Crossing Alert” if the value crosses the thresholds.
Refer to Threshold Crossing Alert
Threshold Band
Trisul can look at long term history of any metric and compute a band within with the metric is usually found.
The band
- is computed for every 5 minute interval
- day of week based so weekends are tracked separately
- can handle holidays and spikey days
Refer to Threshold Band Crossing Alerts
Setup Email Alerts
This menu describes how you can configure Trisul to send you an email when any alert fires.
The way the alerting pipeline works is the following.
- Alerts are first sent to syslog
- The email alert service watches syslog for alerts and dispatches them
Using the Email Alerts Wizard
Trisul has a new Email Alert Wizard that lets you configure everything from one place.
To access that
👉 Login as Admin → Select Context and profile → Under Alerts → Email Alerts Wizard
You can just follow the steps in the wizard
All Resources
Resources are objects linked to intrusion or forensic indicators. They are transferred over the network. Trisul pulls them out, stores, and indexes them separately.
This Menu is used to provide a list of all resource groups available in Trisul
Refer Resource Groups
All FTS Groups
Some resources extracted by Trisul are unstructured but are critical to look up fast. These types of resources are stored in a Full Text Search (FTS) index.
Currently the following FTS resources are supported.
- SSL Certificate Chains - the full printed form with all extensions and attributes
- HTTP Headers - all HTTP request and response headers
Refer to FTS Groups
Trisul Protocols
Various protocols that are mapped on Trisul are listed here. For every protocol a new GUID will be assigned.
To add a new protocol,Select Add New Protocol option.
| Field Name | Description |
|---|---|
| Enter Name | Name of Protocol |
| Enter GUID | GUID for the Protocol(Auto-Generated) |
Trisul Plugins
This menu provides a list of all the Trisul Plugin Classes,their configuration files and when their data was refreshed.
Refer to Trisul Plugins
Bulk Ping Groups
PING groups are used to group IPs for management reasons or to apply different parameters for timeout, TTL, etc.
This menu is used to group a set of IPs and provides us information about the IP reachability, Latency, Status of the IP, packetloss, etc of every individual IP in the range.
SNMP Agent
This menu helps to resolve several Router IPs with their respective SNMP Read community. A multiple number of Router IPs can be added.
To add a new SNMP agent, Select Add New SNMP Agent option
| Field Name | Description |
|---|---|
| IP Address | IP address of snmp device. You can add multiple devices at once. Specify multiple IPs separated by comma |
| SNMP Version | SNMP version v1 or v2c or v3. Select V3 to show SNMPv3 parameters |
| SNMP Read Community | SNMP read community string |